 CAP TODAY Pathology/Laboratory Medicine/Laboratory Management

Anne Paxton
February 2015—In speaking to audiences all over the world about the intricacies of risk management through quality control, QC expert Curtis Parvin, PhD, has noticed a certain pattern over the past 10 years. Following his presentation, he’s likely to hear this reaction: “I’m not sure I totally understand that. It sounds pretty impressive, but how do you expect me to go through that process in my lab?”
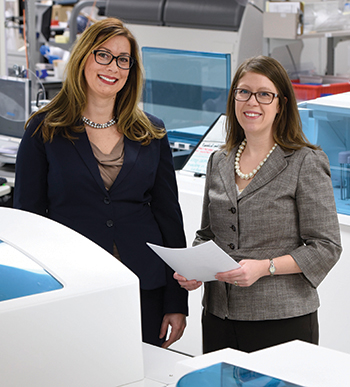
Dr. Nikola Baumann (left) and Darci Block, PhD, co-directors of Mayo Clinic’s central clinical laboratory. They and others are devising tools to help Mayo’s labs make risk assessment an easily documented process.
A reminder, perhaps, that some of the most basic QC questions elude easy answers. “The big question labs are asking in regard to lab QC is not ‘What rule should I be using?’ It’s not ‘What QC material should I be using?’ It’s ‘How often should I be testing QC?’ That’s the question they’re all struggling with,” says Dr. Parvin, who is principal scientist and manager of advanced statistical research in the Quality Systems Division at Bio-Rad Laboratories, Redmond, Wash.
EP23 is the guideline released by the Clinical and Laboratory Standards Institute in 2011 that was intended to help with that task, and the transition period to the IQCP, or Individualized Quality Control Plan, the CMS’ new voluntary QC program, officially began more than a year ago, on Jan. 1, 2014. How are core labs faring in developing optimum QC strategies that integrate key risk management concepts? In interviews with CAP TODAY, experts and core laboratory directors say that clear answers to many burning QC questions are not always at hand. But labs are definitely taking a more systematic approach to their QC programs.
The Mayo Clinic, for example, has consciously opted for a happy medium in setting its QC standards, says Nikola Baumann, PhD, co-director of Mayo’s central clinical laboratory and central processing laboratory. This laboratory at the Rochester, Minn., facility reports more than 5.5 million billable tests per year serving its two hospitals and large outpatient clinic. The laboratory performs routine chemistry, immunoassay, hematology, and coagulation testing.
There are two extremes for QC, Dr. Baumann says: “the minimum CLIA requirement of two concentrations per day for quantitative tests, and then the perfect but impractical world where you run QC with every patient sample so that you never report a result in error.” Because Mayo’s volumes are so high and the results are used almost immediately, “most of our QC frequency is between every two hours and every eight hours. The lower-volume, more robust tests would have QC scheduled every eight hours. At certain times of day, we analyze more than 600 samples per hour and we run QC every two hours for high-volume tests.”
That may not be standard practice at most core laboratories, she notes. “What I’ve seen is that QC tends to be run in the core lab at the times that are convenient in the workflow. It might be scheduled at shift changes or at times when the test volume is lower and people have time to do QC.”
“But when you think about the purpose of QC, that’s the wrong logic. It should really be run at a defined frequency and customized to each test. The frequency should be defined with the goal of detecting errors, minimizing the number of patients affected if an out-of-control situation occurs, and making sure that patient results reported in error can be corrected as soon as possible. Traditionally, that’s not how we’ve designed QC plans in the core lab, mostly because it’s difficult logistically.”
As the leader of a task force within her department that is looking at implementing the EP23 guidelines on risk-based QC, Dr. Baumann and her team surveyed Mayo’s 50-plus testing labs and found that many of them, including the central lab, have been using informal risk assessment to design their QC plans for a long time, but without documenting it.
Now she sees laboratories shifting to a more methodical approach in their QC design. “In the past we have informally assessed risk based on analytical performance, test volume, and the potential impact or risk of reporting incorrect patient results. But now we’re actively developing tools to help the labs at Mayo make risk assessment more of a formalized and easily documented process.”
The CMS’ IQCP has prompted some of this shift. “It made us think there might be more requirements down the road, but also it is just good lab practice. We shouldn’t just keep doing QC as it has always been done, but rather respond to changes and advances in technology, automation, laboratory workflow, and even hospital and patient workflow.”
Several people at Mayo have attended the CLSI’s EP23 workshops and have found the templates and tools the CLSI provides to be helpful. But, she says, larger laboratories can face unique challenges in reshaping their QC plans. “It’s not as easy as just putting down on paper what you would like to do, because in large automated labs there can be limitations to the automated functionality of the systems.” The central lab programs QC to be automatically run at defined times and stored on the analyzers so there is little manual handling of QC material. “Ideally it would be wonderful to customize that for each test, so you could run QC every x number of patients, not generically every four hours, because test volumes change throughout the day.”
That’s a gap in some systems’ flexibility, Dr. Baumann says. But in addition to catering to specific analytes or customizing QC frequency, another area is starting to capture people’s attention: the use of complementary tools to statistical QC. “Statistical QC doesn’t catch every type of error; things like monitoring patient data in real time or using rules in your middleware or LIS to detect errors before statistical QC could—those are receiving more and more attention.”
Labs need to pay attention to what they don’t know as well as to what they do know, Dr. Baumann believes. “We like to review the data and ask questions. What kinds of errors is QC catching? Detecting errors means QC is working; if you aren’t seeing out-of-control QC, it is likely you are missing something. Which types of errors is QC not detecting? And how do we modify our QC plan to be better moving forward? I think sometimes those questions are not being asked in a lot of the discussions we are seeing.”
Reducing errors requires a balancing act, she says. “There are suggestions for balancing error detection and false rejection rates. The way we’ve designed our program in my lab, we have a very high error detection rate. We also have a relatively high false rejection rate, which means we do a lot of unnecessary repeat patient testing because QC was out of control but the changes in patient results were not clinically significant. That’s good for the patient—and I would rather err on that side than sacrifice error detection for lower false rejection rates—but it also means there’s room to optimize how we design our QC strategy. It’s always a work in progress.” she says.
It was the mid-1990s when Dr. Parvin began working with others to develop performance measures that directly tied QC strategies in the laboratory to patient risk. At that time, he recalls, experts in clinical chemistry quality were helping develop the CLIA regulations that eventually required laboratories to run at least two levels of control once a day.

Dr. Parvin
There was no good way of answering the question about when and how long QC testing should be performed, however. “The classical way we assessed the performance of a QC strategy was to look at the probability of error detection and the false rejection rate of a QC rule if an out-of-control condition existed,” Dr. Parvin says. “When it came to how often we should be testing QCs, that classic kind of literature and theory offered no guidance whatsoever.”
Some manufacturers would claim the instruments were so stable that QC wouldn’t need to be done more than once a week or once a month, and laboratorians knew that wouldn’t work, but government regulators needed some kind of consensus anyway. “So the outcome was a recommendation that labs should do QC once a day until somebody comes up with a more scientifically sound way of determining how often QC should be done.”
Dr. Parvin’s 1997 paper with Anne Gronowski, PhD, on the effect of analytical run length on QC performance (Clin Chem. 1997;43[11]:2149–2154) was likely the first to tackle this problem. As a test performance metric, he chose the predicted number of patient results that would fail their quality requirement before the out-of-control condition is detected.
But there’s one problem: Calculating that metric is complex. “The computations are pretty intense,” Dr. Parvin says. That was one factor that led him to work at Bio-Rad on a software tool called Risk Calculator. The tool, which uses IQCP, will be released within the next few months. “It’s a working piece of software, but right now is officially available only in a limited number of labs,” Dr. Parvin says.
Theoretically, Risk Calculator would need to assess risk for each instrument and for each analyte on the instrument. But Bio-Rad is trying to learn how to make this process less burdensome on the lab, Dr. Parvin says. “So you start with the analytes that have low sigma values; they tend to fail more often, or you’ll find that small problems are likely to produce results that fail quality requirements. Those assays that you know are rock solid, where the precision of the assay is one-tenth of the quality requirement, you don’t have to be so concerned about.”
This approach to simplifying QC—taking analytes and dividing them into high and low sigma metric processes—is one recommendation Dr. Parvin makes in his presentation on “Six Effective QC Practices that Don’t Require Advanced Math.” Another recommendation is to gear your QC schedule to the patient testing schedule. “Any time you have a maintenance coming up or a scheduled calibration, you should be testing QCs right before that. If you are in the core lab and you’re not testing 24 hours a day, the last thing you should do at the end of the day is test QCs; that’s the only way you’re going to mitigate the risk for all patient results since the prior QC testing time.” He also recommends trying to make the time between QC evaluations shorter than the time needed to correct results.
When the CLSI first came out with its EP23 guideline document on risk management, Dr. Parvin says, he was excited about it as an effort to map the entire laboratory testing process to identify all possible failure modes and critical control points for some of those modes.
“That’s all wonderful stuff. Most of the examples tend to be problems that occur in the preanalytical phase, such as ensuring that samples are not compromised when they hit the lab, that reagents are within their expiration date, and so on. These are things that labs have always done, but EP23 is just a more formal structure around them.” EP23 devoted only about a paragraph to designing QC based on periodic testing of control materials, so it didn’t address the analytical phase, but that is not surprising in his view because there is already a large amount of literature and guidance on statistical QC design for the analytical phase. In fact, he warns, labs must beware of thinking they can replace a statistical QC design with an EP23-style checkbox.
Standardization of QC across the system is a priority for Geisinger Medical Center in Danville, Pa., which includes five hospitals and several clinics and doctors’ offices. The core laboratory runs about 1,000 hematology specimens a day, says Michele Adler, MT(ASCP), technical specialist for hematology and flow cytometry.
“We are moving everyone to Sysmex analyzers, and we have it set up now so that anyone that’s on Sysmex gets the same lot numbers for QCs. It takes a lot of work considering our lot number changes about once every two months. But if you run short of QC material, you always have somebody to borrow from. And if we are having a problem with a certain parameter across all the instruments, we can see it’s probably the control and not the analyzers.”
Geisinger uses more than two standard deviations as a range across the system. “It’s usually about a three or maybe 3.5 for most parameters,” Adler says. “Twenty or 30 years ago, when instruments weren’t so precise, it was ‘2 SD is in, 3 SD is out.’ But now, everything is so automated you can’t use that 2 SD anymore.”
Adler did a study comparing two analyzers, one with the six sigma range and the other with the 2 SD range, and found the difference was shocking. “I kept track of all the repeats for my QC, and with the 2 SD ranges there were lots and lots of repeats—about a 20 percent rate, whereas using that 3 SD range there was very little: about two to three percent. So that’s a significant savings, not only in technologist time but also in reagent costs.” Core laboratory directors can save their hospitals a lot of money by doing a similar study, in her view.
Besides peer group comparisons produced through Sysmex, Adler says, her laboratory has established a spreadsheet where each site calculates its six sigma values monthly. “As long as they’re all above three, they’re good. If they’re below three, then we’ll check to see what’s going on. Since we’ve been doing that for the last year and a half, twice we’ve had six sigma values less than three and both of them were platelets, and in both cases, instrument problems caused the shift.”
The moving average was established by the lab using six months of data and now goes out of range more than the controls, she says. “When the moving average goes out of that range, we usually find there’s some kind of protein buildup or a partial clog in a line—it’s an instrumentation problem and we clean up the buildup or we bleach or methanol and those values come right back in.” Interestingly, if the lab runs a patient comparison before and after a corrective measure like bleaching, there is no significant difference in the lab values. “So we’re catching instrument problems before they even affect the QC.”
In hematology and chemistry, Adler says, there’s often a mindset that when your QC is out, you repeat it two or three times to get it back in, rather than believe there has to be a problem. “That’s not what a QC is used for. It defeats the whole purpose. But that’s a hard concept to get across to techs. We’ve done a lot of PowerPoints and a lot of talking messages to tell the techs when their QC is out they need to find a reason first before they repeat it.” Success in driving this message home has been a key factor in improving the laboratory’s performance, Adler says.
Setting frequency of QC is a little trickier. “For hematology analyzers, the state requires one QC every eight hours, and CAP requires two, a normal and an abnormal, every 24 hours. We do run three levels every eight hours, and it’s probably too much. So my next thing to tackle is to decrease the controls we run. Now that my six sigmas are working, I’m pretty confident we can cut down on the number of QCs we need to run also.”
A new understanding of how to estimate risk is at the heart of the laboratory’s progress, Adler believes. “You open up that range, but you don’t want any patient results going out incorrectly. But you don’t want to repeat every QC all the time. So there’s a fine line there, and six sigma helps find the balance—especially when you use it in conjunction with moving averages to catch problems with your instrument before they actually affect your QC.”
The core lab at Spectrum Health in Grand Rapids, Mich., encourages all its technologists, any time they suspect something might be going wrong, to check their QC. “If we shorten the time between successful QC results, there are fewer patients we have to repeat. So it’s less work for us,” says laboratory manager Barbara DeVries.
Spectrum conducts hematology, coagulation, chemistry, and blood bank testing 24 hours a day, performing about 5 million tests per year. The expanded test menu and the huge volume have brought a rise in QC to at least nine a day, far beyond the CLIA minimum. “Right now we do three levels of QC per shift, and before we did three levels on day shift and one or two levels on the other shifts,” DeVries says.
Another factor driving the stepped-up QC at Spectrum, says technical specialist Alex Castillo, is the enhanced precision of the assays. “They’ve become so much more accurate that we’ve been able to squeeze our acceptable ranges a little bit. The bad part of that is you won’t always see controls within the ranges you have set. So of course there’s more troubleshooting involved. In general chemistry, that pushes us to run QC more frequently, because psychologically we’re more confident on every shift that our controls are within acceptable limits.”
In immunoassay testing, with its lower volumes, QC is generally run once every 24 hours. That’s for a few reasons, Castillo says. “There’s cost, and also we don’t see QC problems frequently, and the test volume isn’t as high as in general chemistry. If we did have to repeat a 24-hour window of specimens, there wouldn’t be nearly as many as there are in general chemistry.” However, a repeat is a rare event. “I think maybe once in the last couple of years we’ve had to do a 24-hour window.” A repeat of an eight-hour window is more common but still unusual; it might happen three times a year.
Error prevention has taken a much more central role in Spectrum’s core laboratory. For example, the day shift performs QC on every reagent cartridge in the analyzer at the start of the day. “So we may or may not get to that cartridge during the day, but the QC is already done,” Castillo says. The laboratory is hoping to catch problems with that cartridge well before it ends up using it. In addition, the way the analyzers are designed now, “if you put something on that has a different lot number, they won’t even let you use that cartridge,” Castillo says. “That’s also the case with electrolyte reagents.”
The clinical pathologists at Spectrum have set the tolerances, the acceptance levels for QC, higher than they need to be, and “it’s a lot of work—especially for places our size—to do that kind of monitoring,” DeVries says. But the Bio-Rad Unity real-time program has made it much easier for her laboratory to monitor its large volume of QC data.
The laboratory is now developing a first draft of its IQCP policy. “It’s not going to impact our automated chemistry at all because it just won’t apply, but it will help with some of the one-off tests that are moderately complex like fetal fibronectin. That’s an incredibly expensive test where you’re not going to run two QCs every day,” DeVries says.
Keeping staff up to date on QC developments is another Spectrum priority. “We’re a teaching hospital, so we’re always teaching medical technologists and the interns what to look for, the subtle changes in QC when you have to take an action. But just making sure everybody’s on the same page is a big challenge,” DeVries says. “They need to understand the difference between lot-to-lot changes, and what an auto 2 SD is, and how to look in between their controls. It’s a big job, and it can be hard for them to catch on right away and get the whole picture.”
There are a lot of gray areas in QC, Castillo adds. “When is a QC problem significant? When do you troubleshoot and how? A lot of times people don’t know how to make the distinction between an actual problem and an outlier. And sometimes we find ourselves chasing a true value; lots of the testing we do here for biomarkers, and some hormone testing, is not commonly run at most institutions, and finding peer groups can be a problem for us. We have to set our means based on what we are running, but determining how accurate our mean is can be difficult because we don’t have anybody else to compare to.”
Until recently, hematology QC had not made a lot of progress, says Scott Lesher, director of technical support services for instrument manufacturer Sysmex America, Lincolnshire, Ill. A 1994 CAP Q-Probes study found that 95 percent of the participants admitted they were just repeating the same-vial control when there was an error, because there were complex rules that were difficult for laboratorians to follow. “Those same issues are still present in the laboratory today,” Lesher points out.
 Now, however, the analyzers’ technology and the availability of sophisticated digital tools are helping bring improvement. “The analyzers are more reliable and precise. Plus, it was cumbersome in the old days to do manual plotting and calculations, especially for hematology with so many parameters per test. Now computer automation of data and plotting has improved how many data points we can look at, and the Internet has opened up new possibilities with real-time peer comparisons of control data.” Sysmex has about 12,000 analyzers in its peer-comparison program, and has also developed software to provide a more stable, evidence-based calibration process. In addition, Sysmex offers an IQCP program called Insight that allows customers real-time peer comparisons of control data, Lesher says.
Only a small percentage of errors—about 15 percent—come from the analytical phase of testing, Lesher points out. But by using such methods as six sigma risk assessment for QC, laboratories are getting past the concept that just random error causes QC failures, which was often leading laboratory technologists to just repeat same-vial controls.
“Before, many times they would believe the problem was the QC material, and just keep repeating until it came in correct. But now they believe when they get a QC error that there’s an actual problem. If each repeat of QC takes about 20 minutes of a technologist’s time, with all the different parameters in hematology you can imagine how many times you run QC per day. So that’s a significant savings in time and QC material. And it’s also stopped desensitizing laboratorians to QC flags,” Lesher says.
Before evidence-based approaches, “you would just come up with the standard deviation for the analyzer and the controls, then take a multiple of two to three times the SD to come up with your limits.” But this can lead to having vastly different controls from one instrument to the next.
To improve on this record, Sysmex took 500 serial numbers for each model and tracked performance over 500 days of data. “We came up with true performances for each model by parameter and by level, and using the six sigma approach we are able to calculate error detection limits at the edges of normal recovery, so the normal recovery that causes a random error would not flag anymore. We really get rid of the false flagging rate, but we still maintain a 100 percent error detection rate.”
Real-time data from peer groups are allowing laboratories to get better comparability across the nation and a better understanding of the true performance of their analyzers over time, Lesher points out. “These days, we’re really concerned about differences of one percent on some parameters, where in the past it would not even have been considered possible to get down to that range.”
The new IQCP rules from the CMS are helping laboratories enhance their QC programs through risk assessment and quality indicators, in Lesher’s view. And Dr. Parvin has found the same is true of the CLSI’s EP23 program. Says Dr. Parvin: “Tying what we do in the lab to patient risk is a really important theme that has emerged, and EP23 is one of the expressions of that theme. The kinds of activities that EP23 is promoting, along with the activities that statistical QC assessment has been doing for a long time—those two in combination really have the potential to advance the state of the art of QC in the core lab.”
[hr]