Anne Paxton
November 2014—It’s been said that “data” is the plural of “anecdote,” and debate has swirled around whether that is true. Something about data makes most of us feel that it is qualitatively different: more manipulable, more reliable, more helpful in drawing useful conclusions. But is there a new stage that might be considered the plural of data? These days, the health care industry is excited about a concept that promises to catapult the value of laboratory information into a new era. It’s the Enterprise Data Warehouse.
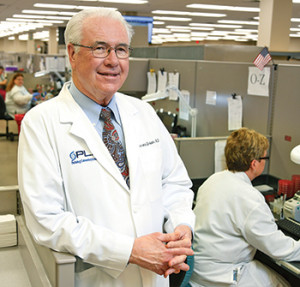
Dr. C. Terrence Dolan of Regional Medical Laboratories, which has been in the vanguard of the data warehouse trend. “We’ve got a major store of very clean data and have already been able to discover things that were not known before in health care,” he says.
In the years ahead, get ready to hear the term “big data analytics” often. “The data warehouse is probably the most powerful management system I’ve ever seen,” says C. Terrence Dolan, MD, president and CEO of Regional Medical Laboratories in Tulsa, Okla. “It takes transactional data—that is, the electronic medical record data—plus hospital information, financial data, and more, and brings it all into a common database optimized for massive analysis.”
He tells health care groups: “If I’m in the health system and if I don’t have an effective Enterprise Data Warehouse in the next five years, I’m in serious trouble.”
RML is one of the largest regional labs in the country, performing 9 million tests a year, and has been in the vanguard of the data warehouse trend. With its Enterprise Data Warehouse, containing an array of data points on 2.3 million patients going back as far as 15 years, RML has been able to achieve cost-saving process improvement and more sophisticated guidance for clinical care.
“We happened to be earlier than most in developing a data warehouse in health care,” Dr. Dolan says, pointing to Intermountain Healthcare and Geisinger Health System as other leaders in this area. “But the gap will be closed soon, because there is so much money pouring into data warehousing and so much work going into it.”
Massive databases, relying heavily on laboratory data, provide a new variety of evidence-based medicine that has vast possibilities waiting to be tapped. Current applications are already shaping key business decisions, directly aiding clinicians, and steering patient treatment. And laboratories, manufacturers, and researchers envision a multitude of potential applications.
What makes massive amounts of data so different from more modest amounts? “Some people will say, ‘I already have a data repository, and it’s the EMR.’ But data warehousing is totally different. Its content goes far beyond the EMR, and the way content is structured within the database allows us to do these new analyses,” Dr. Dolan explains.
Lawrence R. Johnson, MD, RML’s director of hematology, coagulation, flow cytometry, and urinalysis, says it can be challenging to convey the concept of a data warehouse. “Usually when we explain the data warehouse to people, my impression is that they really can’t wrap their minds around it. They don’t quite know what it is.”
One useful comparison is what happens when, after being tested in a controlled population of patients, a drug is approved and goes on the market. Suddenly being used by millions of people, the pharmaceutical may turn out to have significant adverse side effects in a certain subset of patients—effects that weren’t apparent in a trial that had only thousands of subjects. The increase in the quantity of data has now changed the questions that can be asked about the drug’s effects.
That kind of discovery is called “finding things out the hard way,” through adverse consequences, Dr. Johnson says. But RML hopes that the kind of massive database the laboratory has developed could catch or predict such adverse outcomes before they happen.
Academia developed data warehousing years ago, says Dr. Dolan. But the retail trade is the sector that has mastered it. A classic example of how data warehousing can be used is a supermarket’s positioning of items for sale. “With data mining, they determined they should put diapers next to beer, because the dad was sent to pick up the diapers and he gets a six-pack at the same time. The analysis is done by looking at millions and even billions of transactions.”
Similar analytics will transform health care, Dr. Dolan believes. “Information technology has become far more cost-effective. You can buy hardware much cheaper than ever before, and now, as all this data is being captured, it’s cheap and easy to store it. The real trick is what you do with the data.”
Data warehousing is different from data mining, Dr. Dolan points out. “Data mining is a very sophisticated analytic tool where they use mathematic formulas to look for associations no one knew existed. With the warehouse, we are really doing online analytical processing, where we know the questions we want to ask.” But he believes the warehouse, with its 15 years of data, will increasingly move toward data mining. “We’ve got a major store of very clean data and have already been able to discover things that were not known before in health care.”
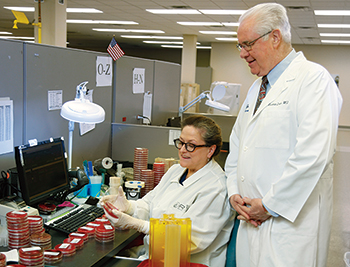
In microbiology, the data warehouse has fostered process improvement, leading to shorter TATs. “Historically, we would read cultures every morning, and we didn’t necessarily adjust for time of incubation.” Urine cultures are read now in precisely 18 hours. “We have determined using the data warehouse the optimal time,” says Dr. Dolan, here with medical technologist Carol Powers.
To protect the confidentiality of the 2.3 million patients included in the database, RML has smaller “data marts” that are subcategories of the warehouse where confidential patient information has been removed. “Sales, the blood bank, human resources—you have access to the data you need for your field. Then desktop software can pull the data into tables and graphs for automated reporting.”
For the business aspects of RML, the data warehouse is “extremely powerful and central to everything we do,” Dr. Dolan says. “We drive the whole company through the warehouse by doing massive analysis of our cost accounting, sales, human resources, financials, etc.”
The financial side of dealing with the government is an example. “Hospitals are penalized if they re-admit within 30 days, and starting next spring they will be penalized if they dismiss someone before two midnights. We’re using the warehouse to analyze all of that to determine why it happens and develop methods to correct it.”
On the medical side, Dr. Dolan cites public health as one area where the data warehouse is helpful. “Our health departments know we have the capability of monitoring emergency departments as well as doctors’ offices. We know their lab ordering patterns and can determine if a pattern changes, so if we’re starting to see a lot of people who have a viral respiratory infection like influenza, we can zero in to the source where an outbreak could have occurred.”
The data warehouse has also facilitated automation of anatomic pathology. “For quality improvement, we’ve put two-dimensional barcodes on blocks of tissue and the slides, then we wrote software to stop processing if there’s a mismatch,” Dr. Dolan says. “Historically, this has been a significant problem in pathology, but we’ve virtually eliminated it with the technology we’ve developed through the warehouse.”
Throughout the laboratory, spectacular improvements have been seen in elapsed time to complete tasks. “None of us ever thought we could improve throughput like that, but we’ve improved quality, we’ve become far more efficient, and we can do far more tests per square foot of lab.”
RML has found the data warehouse the only truly effective means of refining reference ranges. “Since we have all these patients and data for many years, we can truly identify patients who are ‘normal.’ To develop a reference range, we never use less than 100,000 people, and many times we have 200,000. That gives us the ability to eliminate a lot of false-positives.”
Before data warehouses, laboratories lacked adequate tools to adjust reference ranges for their own populations, Dr. Dolan points out. “The accrediting groups all say you need to adjust your reference ranges to actual populations, but in reality, the analytic tools have not been there.”
To analyze ALT testing, the data warehouse was able to look at 317,000 laboratory patient results. By refining the reference ranges, RML reduced the number found “abnormal” from 10 percent to 8.2 percent. “That’s almost 6,000 patients we reported as abnormal who were in fact normal under a more sophisticated reference range. A thousand dollars per workup of a patient is nothing; if you have a potential liver disease, you’ll be doing scans and all kinds of studies and may spend $10,000. But even at $1,000 a patient, that’s $6 million you’ve avoided.”
The data warehouse also has demonstrated increased productivity at RML over the past 11 years. “Most people measure productivity by year and by month; ‘by week’ is unusual, and ‘by hour’ is unheard of. But we look at productivity by all those parameters. Measured by billed units per full-time equivalent, we’ve averaged about a three percent increase in productivity per year for 11 years, a total of 33 percent improvement.” Some of that is due to growth and economies of scale, he says. “But a lot of it, we believe, is due to improving processes.”
Another use of the data warehouse: analyzing workflow to change staffing levels. “We track the average productivity per FTE at 12 weeks, four weeks, and one week, and can predict productivity based on those averages.” By examining the difference between expected productivity and actual productivity through average FTE per billed unit, RML could see it had underestimated staffing in the early morning and overestimated it for afternoon and evening. “Since that time, we’ve made changes and we’re now more optimal on staffing, so people have a more steady workflow, with minimum peaks and valleys.”
In microbiology, too, the data warehouse has fostered process improvement. “Historically, we would read cultures every morning, and we didn’t necessarily adjust for time of incubation. Now, as urine cultures come in, we set them up and read them precisely in 18 hours. We have determined using the data warehouse the optimal time. We can do that reliably because the microbiology department is working 18 hours a day, 365 days a year, so we report them at 18 hours and do an addendum at 24 and 48 hours, if necessary, using a follow-up read to make sure we did not miss an organism. That’s reduced our turnaround time significantly.”
Among the population studies RML has done, one has focused on the 30 percent of the population with chronic diseases who account for 70 to 80 percent of total health care dollars spent. A large percentage of that group are those with diabetes, who are monitored primarily by laboratory results.
“When we looked at these patients, they weren’t getting the consistency of testing as recommended by national groups for good outcomes. So we said okay, this is our criterion: Have the tests done as recommended,” says Dr. Dolan. The plan is for RML to email patients quarterly that it’s time for their hemoglobin A1c, lipids, albumin, etc., “and really monitor these patients appropriately.”
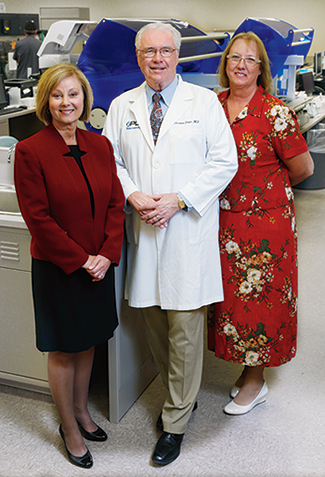
Dr. Dolan with Debbie Smith (left), director of the Enterprise Data Warehouse, and Debbie McClain, director of operations process improvement. RML has averaged about a three percent productivity increase per year for 11 years (measured by billed units per FTE), some of which is due to growth and economies of scale but much of it, they believe, due to improving process.
The laboratory is not trying to generate more testing, he says. “What we’re trying to do is avoid testing that’s not adding value. So we want to make it a package deal. Instead of patients having to go to the physician office to get a test ordered, the doctor can enroll them in this program and the tests will be performed quarterly at the lab, at reasonable cost for what they’re getting.”
Building a data warehouse does cost money, Dr. Dolan says. “But once you have it set up, the upkeep isn’t too bad, then you see major savings by improving processes, eliminating bottlenecks, and so on, because the analytical tools are able to do that for you. We drive all this data into the ‘view from 40,000 feet,’ to let us see our overall processes and where something goes astray. Then, once the warehouse determines the problem and solution, the warehouse never forgets. It will measure the metrics forever.”
As far as I know, there is no data warehouse that has the volume and types of patients that we have with data going back to 1998,” says Dr. Johnson. “We constantly add to it, and our view has always been that anything that can be extracted and stored, we will add—even if it is seemingly mundane or unrelated data.” That includes when and where a lab test was drawn, who the technologist was, when it was run, whether there was a delay, what instrument it was run on, what shift, and even lot numbers of reagents. Patient data such as gender, age, location of residence, and type of insurance and ordering physician data such as the specialty of the physician, where the practice is located, and many other data points also are added. Part of the point of collecting any and all collectable data, he says, is being able to look for unique relationships—relationships that are beyond what is obvious or known to be significant.
Dr. Johnson’s interest in the Enterprise Data Warehouse began about 10 years ago with the parameters on two different CBC instruments. “We were noticing significant variations between the instruments on the same sample despite changing reagent lots and ruling out other causes, and that started my interest in looking retrospectively at CBC data and trying to make useful assumptions or inferences based on the data. This led to developing reference ranges that were stratified by not only the patient’s gender but also their age by decade.”
He followed with a study on the limitations of certain CBC parameters such as the MCV versus the more preferred MCH for determining red blood cell size when samples are stored over time or there is a delay in their measurement. More recently, he has focused on platelet reference ranges personalized for the second and third trimester of a woman’s pregnancy versus the first trimester.
Using the data warehouse and its large numbers of patients to derive a reference population helps make better reference ranges. “Part of the problem with reference ranges is if you get 50 to 100 people, you’re hoping you’ve screened them adequately so that they are ‘normal.’ But a lot of times, they may not have been forthcoming with their medical history or may have disease conditions that are unknown to them or that they don’t think are otherwise significant.”
“When you’re dealing with more than 2 million unique patients, my belief is that by using a sufficient number of filters, you can ‘wash out’ the effect of any outliers or abnormals, because you’ll have so many otherwise ‘normal’ patients. That allows you to make reasonable inferences on what would be a normal hemoglobin value for a male at the age of 35 versus somebody who is 35 and female.”
Since RML is not strictly a reference lab for a specialty hospital—it includes rural hospitals, single and group physician practices, and home health agencies among other groups—its patient population includes a much higher concentration of “normals.” “Most of our lab work is outside of the health system, often at physician offices. It’s more of a ‘real world’ group of patients, which prevents significant skewing of the data.”
As a result, “our data is not strongly biased by having a large population of cancer patients,” for example. While RML does have a significant number of cancer patients, “we can use filters to weed those out such as by looking at who the ordering physician is, their previous pathology results, ICD-9 codes, inpatient pharmacy data, and radiology, among other things.”
What does the data warehouse contain? Everything that can be collected. “We know the demographics of the physician and patient, their gender, their age, often their race, and pharmaceutical data for their inpatient care up to five years and radiologic and other medical history sometimes going back to 1998. Using those pieces, plus all the other laboratory parameters such as kidney function, liver function, iron studies, immunology studies, nutrition-related parameters, numbers of visits to a hospital, numbers of visits to a physician, types of physicians seen, etc., you can develop very sophisticated filters to derive a reference population for whatever it is you are trying to study.”
The longitudinal data are helpful in interpreting samples and in some ways preferable to standard reference ranges, he says. “If someone has lived at a hemoglobin value of 10.5 g/dL—even though that’s probably mildly low for some women and some males—but they’ve lived at that for 10 years, that tells you something meaningful. If they’ve dropped 4 grams of hemoglobin in a span of 48 hours to 10.5, that’s different. So the relative change in the individual patients as well as the tempo of the changes are often useful—not only with hemoglobin but with many other parameters, including kidney function, liver function, thyroid function, autoimmune disease, microbiology—you name it.”
A project that he has been working on over the past couple of years is Monoclonal Gammopathy of Renal Significance (MGRS). “There are subsets of patients who have monoclonal gammopathy of undetermined clinical significance [MGUS], and some of them progress to renal failure and some of them do not. Some progress to more severe degrees of renal failure, and some progress faster than others.”

Dr. Johnson
The question he and others are studying is whether or not there is a useful cutoff in the involved monoclonal serum free light chain value that might enable a clinician to better determine whether a patient is at increased risk of not only progressing to renal failure but also progressing in a shorter amount of time. “We know that these patients often do worse. The idea was to try to determine if there is a significant toxic level of an involved monoclonal light chain that may be significant and flag the clinician.” Under current practices, there is no agreed cutoff for the level of significance of an involved monoclonal serum free light chain, and how to best manage these patients is an open question. “It may be the case that earlier intervention may preserve renal function and improve the outcome, but that remains to be seen,” Dr. Johnson says.
Whether a therapeutic intervention would be warranted is something that needs to be addressed. These patients are sometimes followed less stringently than patients with a known cancer diagnosis. “Currently doctors will use serum free light chain testing in MGUS patients in order to see which of them are at risk for progressing to symptomatic plasma cell myeloma, but it is difficult to know which of these patients may progress to renal failure and whether or not to intervene prior to the development of a frank malignancy in order to preserve renal function.”
With the scale of the Enterprise Data Warehouse, “We now potentially have subsets of patients with MGRS who are at greater risk of progressing rapidly to severe degrees of renal failure.” They can be studied more closely to see if there is justification for therapeutic intervention, Dr. Johnson says.
“Because the data in the data warehouse is not skewed toward patients with myeloma or renal disease because the data is not strictly a referral population, but includes more general types of populations, that gives us the ability to look at the prevalence of disease in a somewhat unselected population group, including patients who are going to their doctors for routine checkups.” Other studies, he says, have had more specific patient populations selected by disease state. By comparison, most people don’t go to a subspecialty center unless something serious is wrong with them.
The goal is to be able to predict that a patient will have a higher likelihood of having a disease or bad outcome before it happens. “If you can prevent the diseases or complications, or ameliorate them prior to any therapeutic interventions becoming worthless or too risky, then you may have improved people’s health overall.”
He hopes other researchers will take the cutoffs indicated by his study based on the retrospective data and start to look prospectively at patients. “Looking at such massive numbers has given us a good starting point, and a prospective study will be necessary in order to see how the patients evolve and whether some patients do better with intervention versus others who do not.”
People tend to take a database and look for known associations, Dr. Johnson says. “But what if I have 500 million data points and I start randomly looking for associations? That gives us abilities we wouldn’t otherwise have. With such large amounts of data, you can look for things that may be unknown—or at least not intuitively obvious.”
The large-scale data allowed Dr. Johnson and fellow researchers to stratify platelet counts not only by gender and decade of age but also by stage of pregnancy. “We know that second- and third-trimester pregnant women often have lower platelet counts than first-trimester women and women who are not pregnant. But the degree of magnitude was not well characterized, and labeling a pregnant patient as thrombocytopenic has significant implications.”
Developing a good cutoff was important, because patients who are labeled as thrombocytopenic could get a potentially costly and invasive workup that is unnecessary. But through use of the data warehouse, “we could tell the OB/GYN what is the probable correct reference range for the platelet counts for a patient’s particular stage of pregnancy so that they do not overcall thrombocytopenia.”
Similarly, the large database allowed revisions of Hgb reference ranges for men and women. “It behooves you not to label somebody as abnormal if you can avoid it. We actually ratcheted the reference range down for average hemoglobin in males over 50 years of age, which allowed us not to overcall anemia.”
Subcategorization of the data is also more useful with the large database. “We can look at very unique patient populations such as Native Americans or other ethnic groups and find differences. We know there are differences in absolute neutrophil counts in Africans, Afro-Americans, and Afro-Caribbeans, and it’s often lower than the reference range that is generally quoted, as many of those studies are biased by the inclusion of a mainly Caucasian population.”
These more personalized reference ranges were possible because of the enormous amount of data. “Even after doing all our filtering, we had almost 100,000 males and 100,000 females and anywhere from 10,000 or more per decade of age. That’s a tremendous amount of statistical firepower.” The goal of medicine should be personalized care, Dr. Johnson says, “and the ability to look at longitudinal data even in individual patients will better enable us to achieve that goal.”
The current standard reference ranges for platelets are based on much smaller populations that usually do not include pregnant patients. “It stands to reason that you should adjust your reference ranges for the health status or disease condition of the patients, because those may affect the result. And one thing we’re going to start looking at is the reference ranges for the serum free light chain assay in patients with different degrees of renal failure.”
The ability to stratify reference ranges in those patients is tantalizing, he says, because the patients will no longer be labeled as having an abnormality that might provoke, for example, a bone marrow aspiration and biopsy.
Does the Enterprise Data Warehouse create a potential problem with having a “firehose” of data that overwhelms? Yes, says Dr. Johnson—if you don’t think you have the right tools to analyze the data. “But if you build enough filters to make the data more manageable, you get a patient population that is more ‘pure,’ if you will, for what you’re trying to study.”
The goal is to be able to predict disease, he says. This is an area where “we’re starting to dip our toes into the water, because we have the longitudinal data to follow patients. With disease prediction, we’re just in the infancy with MGRS. It’s one of our first attempts on a large scale to see whether a certain lab value with a certain cutoff seems to lead to a specific outcome.”
Even where no therapeutic intervention is available, there is a benefit to understanding that a patient is at risk of a bad outcome, Dr. Johnson emphasizes. “While you may not be able to cure the patients, you may be able to provide other interventions that improve their quality of life, allow them to plan for end-of-life issues, or allow you to study them more intensely. And you could use any data you derive from them to treat the next generation of patients with the same problem.”
Some clinician practices have changed because of the findings from the research using the data warehouse. “Our hemoglobin reference ranges have changed quite a bit of patient practice because we revised what we call ‘anemic.’ We also revised our cutoffs for microcytic and macrocytic red cells, and that changes outcome behaviors as well, because if you call someone microcytic, that might prompt an investigation for iron deficiency, blood loss being the most common cause in older patients and then cancer being the main concern, versus something else.”
“So improving cutoffs lets you more reliably avoid overcalling or even undercalling the diagnosis, and we’ve done that. We’ve actually used our cutoffs to generate algorithms to investigate anemia. We use the hemoglobin value, the MCH, and the absolute reticulocyte count, and that will prompt a certain subset of tests to be ordered before we get a peripheral blood smear.”
After reviewing the peripheral blood smear, additional tests may be ordered or suggested and then an integrated narrative report is issued, taking into account any available current or previous laboratory, radiologic, pharmacologic, and clinical data. “This method either gives us a clean diagnosis or it may prompt additional investigation. But the point is that it’s a multi-modal approach; we don’t interpret any one finding in isolation.” If clinicians say they are worried about a patient despite having issued a report, the pathologist, and by extension the laboratory, can also go back and look at all the data to see if there is an explanation or something that needs exploring.
The data warehouse also allows the lab to look at and flag potential problems with an instrument or variations within subsets of patients. “That may prompt us to see if there’s a real change in the patient or something else that was a problem, such as getting the wrong sample, or having a particular problem with a reagent lot on a certain shift. If you can do that in real time, you can react appropriately before anything deleterious occurs to the patient.”
Comparing test methods is another capability the data warehouse provides. Seven years ago, “we used the data warehouse when we were looking at human papillomavirus testing. There was an FDA-approved platform that was very expensive versus a non-FDA–approved platform, and we showed with large amounts of data that the tests were equivalent, even though the non-FDA–approved platform was cheaper. That saved our patients and clients a lot of money, and gave them the peace of mind to know they could trust the results of the non-FDA–approved platform.”
What he would like to do next is to take the data warehouse and perform correlation matrices. “We could just see what we could find out: what are possible correlations and what should prompt subsequent investigation. That takes a lot of computing power when you are dealing with so many variables,” he adds. But then again, “The data is already there. I have to use computer and analyst time to go back and mine it, but based on the findings, we can figure out how to target further efforts.”
In medicine as elsewhere, causation is always difficult to prove, Dr. Johnson says. “But if you have 2.3 million unique patients to look at, and you can reasonably say, ‘on average for 50 percent of my patients with a certain profile, when x happened, y occurred,’ then you may avoid a lot of unnecessary testing and therapy.” At the least it should prompt additional investigation into a potentially clinically significant association that might have previously gone unnoticed, he says.
Despite initial troubles appreciating the power of the data warehouse, manufacturers recently have come back to RML with ideas for using the data in order to better understand their instruments. “So we also use the data to look at where there may be weak points in an instrument that they may not be aware of, or perhaps additional uses for their assays that they haven’t envisioned. Sometimes it just takes the tincture of time for somebody to get an understanding of how the data warehouse may be very valuable and useful,” Dr. Johnson says.
The only limitation on uses of the data warehouse is the user’s imagination, he says. “With this database, there are a lot of questions that can be answered outright, or if not, the data can at least get you started on the right path to an answer.”
Dr. Dolan sees the health care system at a crisis point. “We’re on a path in spending that’s not sustainable. But using these powerful analytic tools, we can truly analyze where our problems are and develop strategies to fix them. We can redesign, reengineer, and then use the warehouse to monitor and fine-tune the strategies and make sure the problems stay fixed. The data warehouse gives us a tool to truly manage health care delivery.”
[hr]
Anne Paxton is a writer in Seattle.
![]()