Excel tool color codes persistent problems in lab test ordering
May 2019—Variety may be the spice of life, but in the pathology lab, it may present a conundrum. Case in point: The LIS is a rich source of data about lab test utilization, but managing millions of disparate pieces of data to assess test utilization can be difficult. But not to Tylis Y. Chang, MD, of Northwell Health.
Using his background in genomics, Dr. Chang, chief medical information officer and vice chair of pathology and laboratory medicine, created a Microsoft Excel-based heat map tool that displays in vivid colors the variations in test ordering patterns among providers. “Within the framework of Lean, when we look at variability, we see potential opportunity for improvement,” says Dr. Chang. “But how do you look at too much data and then condense that knowledge into a form that is tractable and actionable? That was the motivation for the heat map.”
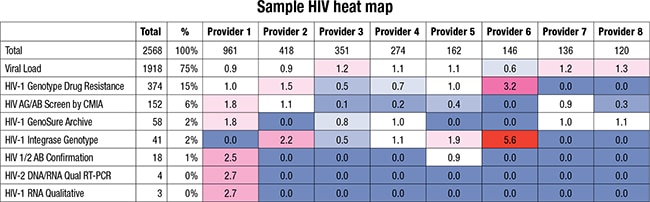
A heat map showing the number of HIV tests ordered by providers relative to their peers. Color coding shows how much each provider’s ordering frequency deviates from the baseline utilization index of 1.0, with higher values becoming increasingly darker red and lower values becoming increasingly darker blue. Values close to 1.0 appear in white.
Dr. Chang’s first step, undertaken about three years ago, was to organize Northwell’s providers from across its 23 hospitals into cohorts based on physician specialty and patient population and export from the LIS a record of all orders from those providers over a given period. Next, he created a formula to program Excel to calculate how often each provider was ordering a particular test relative to other providers in the same cohort to arrive at what he called the “utilization index” (UI = [provider volume of specific test/provider volume of all tests]/[cohort volume of specific test/cohort volume of all tests]).
Dr. Chang used an Excel pivot table to generate a table for each cohort showing how many of each test were ordered by each provider. Applying the UI formula, he converted the values in each table from the number of tests ordered to the frequency relative to other providers. A provider with a UI of one orders a test about as frequently as his or her peers. A provider with a UI of greater than one orders it more frequently, and less than one, less frequently. Using conditional formatting, an Excel feature designed to highlight important information, Dr. Chang color-coded the heat map to allow quicker identification of especially high or low UIs. Color coding shows how far each provider’s UI deviates from one, with higher values becoming progressively darker red and lower values darker blue. (Values close to one appear in white.)
As a resident and a mentee of Dr. Chang with an interest in lab test overutilization, Nina Haghi, MD, wrote an abstract and later co-authored an article, published in the Journal of Pathology Informatics (Ziemba YC, et al. 2018;9[31]), detailing the project. “We looked at about 20 tests. One of the big ones that we noticed right away that showed a lot of variation was vitamin D ordering on inpatients,” says Dr. Haghi, who is now associate medical director of laboratories at Long Island Jewish Medical Center Northwell Health. The heat map revealed four providers who ordered vitamin D 1,25-dihydroxy more frequently than their peers while ordering vitamin D 25-hydroxy less frequently.
The dichotomy pointed to the well-recognized problem of confusing test names in an institution’s EHR, says Yonah Ziemba, MD, a second-year resident in pathology and laboratory medicine at Northwell Health and a co-author of the journal article. “This is a perpetual issue that many health systems are facing,” he explains. “There is no standardized system for test names, and the names that are displayed can be very ambiguous. In our laboratory, we offer 13 different tests for HIV. Each is appropriate in a different scenario, and the differences are too subtle to express in a name that is limited to less than 50 characters.” Dr. Ziemba is creating a heat map to look at the ordering patterns for all 13 tests. The heat map is expected to reveal which providers are ordering tests that are rarely appropriate, mistaking them for a common HIV screening test.
Variations due to confusing test nomenclature are likely to be more of a problem in larger health care systems, especially those that have acquired hospitals with different EHRs, Dr. Haghi says, but institutions of any size could apply the heat map tool in many ways. “Just look at variability in, let’s say, the inpatient ordering patterns of ICU attendings in one hospital. That’s the awesome thing about it—it can be tailored to specialty, to a location within the hospital, or to a patient population. It just depends on how you sort the information from your LIS.”
The heat map is a built-in feature of Excel, and setting it up requires no particular expertise, says Dr. Ziemba. “I would say designing the workflow for the first time involves some trial and error, but after that it’s trivial,” he explains. “It doesn’t require any background in pathology or informatics. I think anyone who has used pivot tables in Excel and follows the instructions [in the Journal of Pathology Informatics article] would be able to do it successfully.”
When using the heat map, Dr. Chang points out, it’s important to remember that not every variation indicates a problem, and discovering differences in ordering patterns should not lead to finger-pointing. “If you’re different, it doesn’t necessarily mean you’re wrong; it just means we should ask questions,” he explains. “Sometimes the proficiency test, as well as these utilization maps, will suggest that the person who is different from everyone else is ahead of the curve because they’ve realized something, incorporated something new into their practice, that everyone else is catching up to. So the fundamental model is how can we have a conversation that isn’t about blaming people but that is more about finding the best practice.”
Dr. Haghi concurs. “As pathologists and owners of this data, it’s our responsibility to provide feedback to the providers, and I think all of that comes down to opening up a dialogue,” she says. “We’re basically going department to department, showing them that we have this capability. We want to present it to them as a collaborative tool.” The response from clinicians has been largely positive, she adds.
Yet Dr. Chang offers a word of caution. Before introducing the technology to providers, he advises, learn how the business unit is organized and figure out its motivations and priorities. If providers are overwhelmed, he explains, “their immediate response, if you’re not careful in how you approach it, is ‘what are you going to tell me I’m doing wrong now?’ And, of course, there’s no road forward there to making progress. The key is understanding who’s amenable to change and how to incorporate that.”—Jan Bowers
Dr. Aller teaches informatics in the Department of Pathology, University of Southern California, Los Angeles. He can be reached at raller@usc.edu. Hal Weiner is president of Weiner Consulting Services LLC, Eugene, Ore. He can be reached at hal@weinerconsulting.com.