June 2017—In the chapter “Diagnostic Errors and Cognitive Bias” in Patient Safety in Anatomic & Clinical Pathology Laboratories, Stephen S. Raab, MD, writes about pathology work process and cognitive failures, pattern recognition and cognitive strategies, interpretive error, and mitigation and improving safety. Here is his section on pathologist cognition. Dr. Raab is a professor of pathology at the University of Mississippi Medical Center, Jackson.
Most medical practitioners use a form of pattern recognition when rendering a diagnostic opinion. Anatomic pathologists make interpretations of gross tissue and cellular-level disease using the cognitive method of image-based pattern recognition. Clinical pathologists also use image-based pattern recognition in fields such as microbiology, flow cytometric analysis, and transfusion medicine. For a more detailed discussion, anatomic pathology pattern recognition will be discussed.
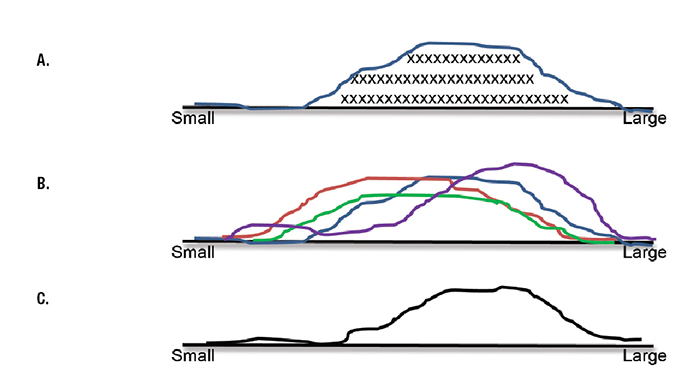
Fig. 1. A. Qualitative representation of nuclear size in the cells of a cervical intraepithelial neoplasia 1 (CIN I). Each X represents the size of one cell nucleus. The curve represents the frequency distribution of nuclear size in all the cells in the specimen. B. Frequency distribution of nuclear size in four specimens of CIN I. C. Normalized frequency distribution of nuclear size in four specimens of CIN I.
For this process at a cellular level, a pathologist makes a diagnosis of a specific disease by (1) visually examining a cellular-level image obtained from a patient’s bodily tissue (stimulus detection), (2) breaking down the stimulus into component characteristics (eg, assessing for the presence of criteria), and (3) associating a specific combination of observed morphologic criteria with that specific disease (feature comparison and recognition). A pathologist may use additional data—such as clinical history, radiologic impressions, or other inputs—in the decision-making process. These data often construct a specific context in which the pattern recognition occurs.
Gross tissue examination also involves pattern recognition, which generally results in producing descriptive data that are used later in cellular disease decision making and inform sectioning protocols.
Pathologists generally learn gross and cellular-level pattern recognition in an apprenticeship environment in which pathologists with more expertise (masters) teach these patterns of criteria and the associated diagnosis of a specific disease to less experienced pathologists or trainees (novices).
Using the process of pattern recognition, a pathologist examines a tissue slide and looks for criteria of normality and abnormality within the tissue. Pattern recognition depends on linking the observed patterns of criteria with knowledge of mental maps of patterns of criteria that represent specific diseases. The presence of normal tissue in the same sample, for comparison, is often useful.
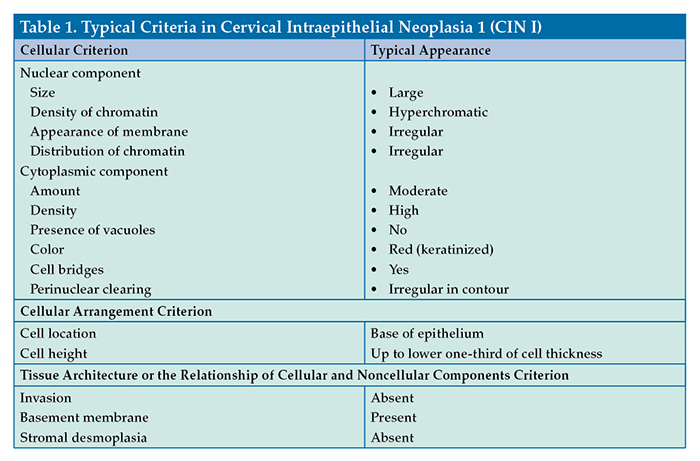
A criterion describes (1) a specific characteristic of a cell (eg, morphologic feature of color, size, shape); (2) the specific arrangement of cells (eg, small clusters, sheets, glandular-like structures); or (3) the specific tissue architecture or relationship of cellular and noncellular components (eg, invasion, necrosis, microcalcification). Table 1 shows examples of typical criteria observed in a patient who has cervical intraepithelial neoplasia 1 (CIN I). This is not an exhaustive list of criteria because, in actuality, the individual cells, cellular arrangements, and cellular relationships display a large variety of appearances.
Some criteria are more important than other criteria in making a diagnosis, as these criteria are more representative of a group of diseases or a specific disease.
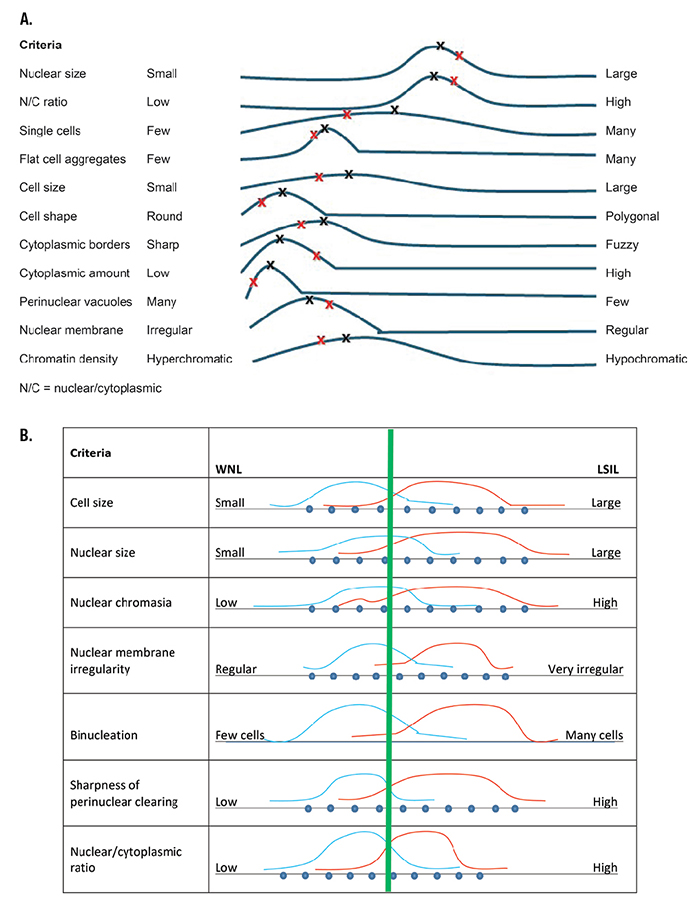
Fig. 2. A. Pap test low-grade squamous intraepithelial lesion (LSIL) pattern spectrum for an expert pathologist. The black Xs show a “classic” case (every criterion is at the median frequency distribution). Patient VK’s Pap test criteria are shown by the red Xs. B. Expert’s within normal limits (WNL) LSIL criteria comparison.
A criterion may have a variable appearance within an individual case of a disease. Some of this variability is real and some is artifact, defined as an artificial product or effect introduced by technology used in a scientific investigation, such as a diagnostic or screening test. An example of an analytic process artifact is truncated nuclear structures secondary to tissue sectioning. Artifacts are introduced in both the preanalytic and analytic testing phases, and the recognition of the effect of artifact in pattern recognition is extremely important. The preanalytic steps of sampling (which alters size, shape, and gross and cellular features), tissue fixation, and processing are major factors that alter important criteria for all disease and nondisease states.
Variability in criteria is readily apparent in Fig. 1A, regarding the size of a CIN I cell nucleus, with some cell nuclei being large and other cell nuclei appearing smaller. A qualitative frequency distribution of CIN I nuclear size is shown in Fig. 1B. Investigators have further quantified the distribution of an individual criterion (eg, cell size, nuclear chromatin appearance, or mitotic frequency) for a variety of diseases.
Of course, criteria do not have the same frequency distribution among specimens from the population of patients who have the same disease. For example, Fig. 1C shows the frequency distribution of nuclear size in specimens from four different patients who have CIN I. On the average, slides from some biopsy specimens of CIN I have more nuclei of larger size than other specimens—a single, fixed prototype (of the criterion of nuclear size) does not exist. For a malignancy such as an invasive cervical squamous cell carcinoma, the variation in nuclear size enters into the assessment of tumor differentiation (ie, well, moderately, or poorly differentiated).
Some diseases are considered to have well-defined histologic or cytopathologic variants, exemplifying the predominance of specific criteria. Other diseases have several well-known variants that display different prominent criteria. For example, histologic preparation of cervical biopsy tissue from a patient who has CIN I may show cells having convoluted nuclei that are typical of changes caused by human papillomavirus or nuclei showing the features of classic mild dysplasia. A cervical biopsy sample from a patient who has an invasive cervical squamous cell carcinoma may have a keratinized, nonkeratinized, or spindled cell appearance.
The combination of criteria is the pattern of the disease. An example of a qualitative disease pattern-of-criteria plot or disease-pattern/spectrum is shown in Fig. 2A, for the diagnosis of the classic presentation of low-grade squamous intraepithelial lesion (LSIL) on a liquid-based Papanicolaou (Pap) test. The LSIL pattern/spectrum generally is a template that is based on an expert’s opinion or mental map, which, in turn, is based on that expert’s apprenticeship training, experiences, and the large number of cases that the expert has examined in their practice. These templates generally are not firmly fixed and represent estimations of general patterns that are difficult to quantify.
 Nonclassic presentations of a specific disease are caused by several factors, including patient-related factors (eg, unusual or rare disease morphologic presentation) and artifacts. The disease pattern spectrum of a population of nonclassic presentations of a specific disease may overlap with the spectrum of the classic presentation or represent an entirely different mental map.
In the current method of apprenticeship training, novices implicitly learn disease pattern spectra of a local expert mentor and from textbooks written by other experts. As the novice examines more and more patient specimens of classic and nonclassic presentations of disease, the novice develops their own disease pattern spectrum as a result of the process of learning, and it changes over time (and changes more dramatically for novices). The formation of disease pattern spectra stabilize as more patient specimens are encountered.
Fig. 2B shows an expert’s two disease pattern spectra of within-normal-limits (WNL) Pap tests and of LSIL Pap tests. The green line is the expert’s threshold of separation of normal from LSIL based on the pattern of criteria. In reality, this threshold is not firm but may change subtly on a frequent basis. This borderline may further be altered by inclusion of diagnoses of greater uncertainty (eg, atypical cells of undetermined significance or neither WNL or LSIL).