
Amy Carpenter
October 2025—Speakers in a session at the ADLM meeting in July walked attendees through their real-life cases and quandaries that called for troubleshooting skill and left their laboratories with lessons learned from each.
Offering up what they called lab adventures were Joe M. El-Khoury, PhD, DABCC, professor of laboratory medicine at Yale School of Medicine; Christopher Farnsworth, PhD, DABCC, associate professor of pathology and immunology at Washington University School of Medicine in St. Louis; and Reid Rosehill, MS, MLS(ASCP), laboratory manager at the University of California San Francisco.
Rosehill presented a case in which eight consecutive CBC samples had turbidity flags because their mean corpuscular hemoglobin concentrations were greater than 37.5 g/dL. The laboratory had three hematology analyzers, all the same model, and an initial investigation revealed that all eight samples flagged for turbidity originated from the same analyzer.
To troubleshoot, patient samples were repeated on a second analyzer. No issues were seen in white blood cell counts, but differences were seen in the red blood cell parameters and in the hemoglobin and hematocrit, and only slightly in platelet counts but not affecting WBCs.
The instrument uses different pathways to count WBCs, RBCs, and platelets, “so we can pinpoint where this issue might be in our analyzer,” Rosehill said, if the problem is the analyzer and not the sample.
When quality control was run on the analyzer that flagged the eight samples for turbidity, RBC parameters were found to be most affected, “just like our patient repeats,” he said. QC was acceptable for WBC counts and differential parameters. QC for platelet counts was acceptable but near −2SD for all three levels of control.
“So troubleshooting was isolated to the RBC and platelet-specific measurement pathway,” Rosehill said. “Something’s going on in that pathway that’s causing a higher hemoglobin measurement” than otherwise expected on these samples.
Automated instrument purges, an automated cleaning cycle, and manual cleaning of aperture, reaction wells, and drain tubing were the corrective actions taken. Subsequently, QC was run and found to be acceptable for all parameters.
“In this case it was a clot that got stuck in the RBC-platelet channel, which caused the flow through that channel to go slower than it normally would, thereby increasing the hemoglobin that’s coming off of there,” generating turbidity flags, Rosehill said. Elevated MCHC is often attributed to sample interferences, such as lipemia or cold agglutinins, but this case highlights the need to consider analyzer malfunction as a root cause.
The takeaways: “Just because you have a sample flag doesn’t always mean it’s your sample. It could definitely be your instrument,” he said. And “don’t ignore flags. They often point to instrument-specific issues.”
Dr. Farnsworth, medical director of clinical chemistry and point-of-care testing at Barnes-Jewish Hospital in St. Louis, shared his case of a 62-year-old male who arrived at the emergency department with nausea, vomiting, and weakness and a significant medical history: previous myocardial infarction, gastroesophageal reflux disease, hyperlipidemia, hypertension, coronary artery bypass grafting, and coronary artery disease.
Two days earlier, he was seen at another ED with pancreatitis; he was discharged with a G-tube placement. EMS brought him to the second ED after he was found lethargic, weak, and pale.
The patient’s blood pressure was 60/40; temperature, 37.7°C; pulse, 83; respiration rate, 14; and Sp02, 100 percent. He was alert and oriented × 4. His current medications were atorvastatin, aspirin (81 mg), and the factor Xa inhibitor Eliquis.
The patient’s laboratory test results on admission were critical for glucose (46 mg/dL) and hemoglobin (2.6 g/dL). Lactate was 21.1 mmol/L. Hematocrit was very low, MCH and MCHC were low, and RDW CV and SD were elevated. Prothrombin time/INR results were elevated at 19.8 and 1.7, respectively.

The patient had a negative pathogen panel for influenza A and B RNA, RSV RNA, and COVID-19 RNA. His blood culture was pending. “They were potentially worried about sepsis,” Dr. Farnsworth said.
Blood gas analysis showed an elevated bicarbonate level (HCO3, ven [Calc] POC: 32 mmol/L). The patient’s low protein concentration (1.4 g/dL) could have been consistent with significant liver disease, Dr. Farnsworth said.
The patient’s chloride level was 99 mmol/L. In a case of IV fluid contamination, high chloride would be expected, he said. And if it is normal saline, for example, “you’d expect everything besides sodium and chloride to be diluted.”
The clinician was concerned about hypoglycemia, so glucose testing was repeated; the two POC glucose results were 236 mg/dL and 180 mg/dL. Imaging was done to assess for a bleed because of the Hgb and Hct results. Eliquis was stopped. There was no evidence of a gastrointestinal bleed, Dr. Farnsworth said, but the constellation of findings was concerning for mesenteric ischemia. Surgical consultation and correlation with lactate were recommended.
CT scan without contrast to assess for a brain bleed was negative, as was a chest x-ray.
The patient received two units of RBCs, which increased his hemoglobin from 2.6 to 11 g/dL and his hematocrit from < 14.6 to 34.7 percent.
The patient’s high-sensitivity troponin T test result on admission was 17 ng/L, and the follow-up result two hours later was 51 ng/L, Dr. Farnsworth said, noting his cardiac history. “We’re telling them [in the report] we think this is significant, that it looks like there’s an acute pattern,” he said. However, the patient’s EKG was fairly normal.
In a follow-up comprehensive metabolic panel, more than half of the reported analyte concentrations were elevated or low.
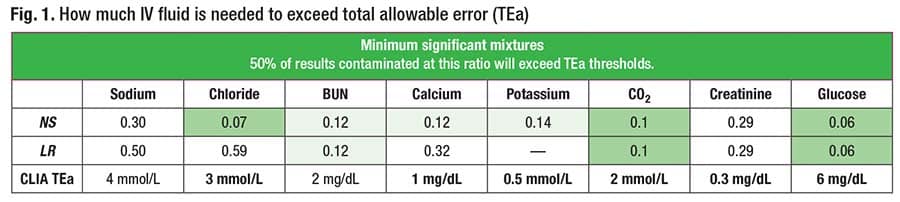
IV fluid contamination was found to be the cause, and the fluid was lactated Ringer’s solution, Dr. Farnsworth said. Normal saline would decrease most analyte concentrations with the exception of sodium and chloride. Lactated Ringer’s fluid has fairly normal sodium (130 mmol/L), chloride (109 mmol/L), and potassium (4 mmol/L). Variations in analyte concentrations that would normally trigger a response in the laboratory, such as an increased chloride or decreased calcium, are generally insignificant. “Lactated Ringer’s is really hard to see,” Dr. Farnsworth said, because it is physiologically similar to blood.
The patient’s lactate level was still elevated at follow-up, though it had decreased from 21.1 to 2.5 mmol/L. “I’ve never seen one get up to 21, which may have reflected a physiologic lactic acidosis on top of Ringer’s,” he said.
The acute change was due to IV fluid contamination in that tube at the time of draw, he said. The sample was about 80 percent lactated Ringer’s in this case, “so not very much blood, which is why creatinine is so incredibly low.” The patient underwent a significant amount of unnecessary workup.
The patient was diagnosed with severe dehydration secondary to G-tube output. There was a concern for sepsis versus hypovolemia and shock. Hospitalization was prolonged because of the patient’s need for IV fluids.
Dr. Farnsworth and Nicholas Spies, MD, studied the impact and frequency of IV fluid contamination on the basic metabolic panel using quality metrics (Spies NC, et al. J Lab Med. 2024;48[1]:29–36). In Fig. 1 are the mixture ratios at which half of the simulated contamination results exceeded the quality metric thresholds for total allowable error.
To begin his recounting of a case, Dr. El-Khoury, director of clinical chemistry at Yale-New Haven Health, shared an email he received from a colleague at another laboratory.
“Do you know our rationale for using the anion gap equation that does not include potassium? I want to switch and am not sure what I’m missing.”
His colleague wrote that their laboratory had had issues with low anion gaps that are not at all clinically relevant and seem to be driven by the CO2 variability. “Initially it seemed to be worse with the lithium heparin,” the colleague wrote, “so we switched back to SST (other analytes were problematic in Li-Hep as well), and I’m not quite sure yet that it has resolved it fully.
“I couldn’t figure out from the literature why it would be a significant problem to include it,” the colleague concluded, “but it would solve my low anion gap problem, though I haven’t really considered if it would create any others.”
An anion gap is sodium minus bicarbonate (i.e. total CO2) plus chloride, Dr. El-Khoury noted, so a low total CO2 level would not cause an anion gap problem.

“If you change the anion gap to include potassium, all it’s going to do is shift everything [new results and new reference interval] by the same amount,” Dr. El-Khoury said. As tempting as it is to add potassium to raise your anion gap results, “it likely wouldn’t make a difference. So this is why I did not answer with, ‘Yes, let’s go and do that.’” There is a problem, Dr. El-Khoury said, so what is it and how should a low anion gap problem in the laboratory be handled?
Dr. El-Khoury requested examples of his colleague’s anion gap sample rerun data for total CO2 and found significantly different anion gap values between the first and second runs: 5 and 7, 5 and 6, 2 and 5, 3 and 8, and 0 and 3. More than one hour passed between all first and second runs.
While the laboratory initially concluded there was a problem with total CO2 levels, it was not acceptable to run total CO2 more than an hour later. “That second result should not be posted to the chart. It’s falsely decreasing, so you’re causing the anion gap to go up,” Dr. El-Khoury said. Luckily, the laboratory had not released the rerun total CO2 results to the chart, but was using the data to troubleshoot and it was misleading.
As for the other laboratory’s concern about using serum versus plasma gel separator tubes, Dr. El-Khoury cited a study in which the authors found that the collection tube type did not affect chloride, total CO2, or sodium levels at baseline (Ayala-Lopez N, et al. Clin Chim Acta. 2021;520:118–125). The exception was with the use of plasma tubes without gel separators, but that tube type is not being used for total CO2. “The matrix would not affect those specific analytes, so that’s not an issue.”
In Fig. 2 are the reference intervals for sodium, chloride, total CO2, and anion gap for the colleague’s hospital (hospital A), Yale-New Haven Hospital (hospital B), and another hospital in the Yale-New Haven Health network (hospital C). Hospitals B and C use the same instrument and have an anion gap reference interval of 7–18; hospital A uses a different instrument and has an anion gap reference interval of 5–17.
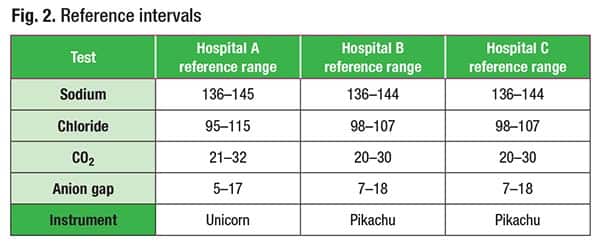 Dr. El-Khoury recalled an abstract published for what he referred to as the unicorn instrument used by hospital A in which authors from an academic medical center, using more than 30,000 results, reported that with the implementation of a new analyzer, they saw a drop in their median anion gap from 11 to 7 mmol/L. Median sodium decreased from 140 to 137 mmol/L, and median chloride increased from 103 to 105 mmol/L. The authors wrote, “The combination of these subtle shifts in electrolytes largely explains the decrease in anion gap median after implementation of new instrumentation.” Based on this data, the anion gap reference range was lowered to 3–14 mmol/L from 6–17 mmol/L for the same analyzer hospital A is using (Selvaratnam R, et al. Am J Clin Pathol. 2015;143 [suppl 1]:A051).
“There are labs using the wrong anion gap,” Dr. El-Khoury said. “There are two distributions based on different methods, one that’s much lower and one that’s higher.” And clinicians will call the laboratory to ask why an anion gap reference interval is too low or high, unaware that what they see in textbooks and online is based on other methods. “People say, ‘If it’s over 12, we should be flagging.’ No, your method is up to 17. Depending on your method,” he said, “you could have these slight shifts in electrolytes that contribute to bigger shifts in the anion gap.”
The takeaways: “Problems with reference intervals can surface as a perception of low or high results among your clinicians,” he said. And IVD manufacturers do not provide reference intervals for calculated measures. “So it’s something you have to take care of” by consulting the literature to determine reference intervals for equations and calculations derived using similar methods for the individual tests.
Dr. El-Khoury presented another case in which four of five proficiency test sample results for bicarbonate had an unacceptable grade. The previous proficiency test results were low.
The proficiency testing provider instructed that bicarbonate be analyzed promptly after opening the vial.
To rotate CHM Surveys among the first, second, and third shifts, per the PT provider’s recommendations, the samples were prepared, aliquoted, and run by the first shift for the C-C Survey, while for the C-B Survey they were prepared by the first shift and then stored in the fridge and run by the second shift, and for the C-A Survey, prepared by the first shift and then stored in the fridge and run by the third shift.
It explains the trend the laboratory saw, Dr. El-Khoury said. “When the first shift ran the samples right away, the C-C, we were spot-on.” The second shift saw a negative drift. “Then on the third, the C-A, that’s when it failed. The sample sat too long in the fridge.”
“Even though they had good intentions in what they were trying to do, you cannot do it this way with that Survey,” Dr. El-Khoury said. “If you want to rotate it between shifts, the shift that’s running it needs to prepare it themselves and then run it.”
The takeaway: “Check with staff” on the preanalytics—“what are they doing, how are they handling samples?”
Dr. Farnsworth shared the case of a 49-year-old female who presented to the ED with chest pain, shortness of breath, and radiating left-sided pressure.
Her medical history included heart failure with preserved ejection fraction; four myocardial infarctions, one of which occurred six months before her ED visit; and lupus, asthma, and reduced lung function. Multiple stents had been placed. She denied fever, chills, rhinorrhea, cough, increased leg swelling, dysuria, hematuria, abdominal pain, nausea, and vomiting.
The ED visit followed an outpatient visit with her cardiologist for the chest tightness and shortness of breath, though she reported the symptoms subsiding after inhaler use. Because of that and the normal EKG performed in the cardiology visit, the symptoms were assumed to be pulmonary. However, a safety check measured 9,990 ng/L for high-sensitivity troponin I.
“So the provider immediately called her and sent her to the ED,” Dr. Farnsworth said. The patient presented at a different ED, one that measures high-sensitivity troponin T, and that result was 19 ng/L. “The sex-specific reference interval on this assay will be 17 [ng/L],” he said, “so she is just slightly above the 99th percentile.” NT-proBNP was 463 pg/mL.
Two repeat high-sensitivity troponin T tests were performed; the results were 17 ng/L and 18 ng/L. She still had the presenting symptom of chest pain, Dr. Farnsworth said, and was therefore given nitroglycerin, a heparin drip, and Lasix (furosemide), and her symptoms subsided. She was diagnosed with unstable angina. Cardiac catheterization was recommended, but the patient wanted to be transferred to her primary provider’s clinic at a different hospital in the same network.
When the patient presented at a different hospital the next day for the cardiac catheterization, her cardiologist ordered a new hs-cTnI test, and the result was 10,327 ng/L.
The laboratory also ran a test using a heterophile blocking reagent to rule out a heterophile antibody as a cause of the elevated hs-cTnI results. “On a heterophile you potentially have interference in the assay causing the capture and detection antibodies to crosslink, and this causes falsely elevated results,” he said. “When you add the blocking reagent, it stops that interaction from happening, and it no longer has a heterophile antibody result.”
In this case, the initial test result was 9,432 ng/L, and the heterophile result was similar at 9,342 ng/L. “This is not heterophile,” he said.
Macrotroponin is a possibility, so the laboratory measured polyethylene glycol precipitation. The patient’s initial cTnI was 10,327 ng/L, and after the PEG precipitation it was 1,123 ng/L. “That’s a big drop.”
Alternatively, macrotroponin can be pulled down using protein A and protein G beads. Protein A is an S. aureus protein. “Its physiologic role is to protect bacteria from the host immune response, but we can use it in the lab to pull out antibodies,” Dr. Farnsworth said. “In this case, if there’s an IgG or an IgA, it’s going to bind to that particular antibody and you’re going to see a reduction after you do that precipitation.” In this case, the initial result was 8,420 ng/L, and the post-protein A/G result was 1,432 ng/L.
Discordance between cTnT and cTnI is physiologic and expected in a healthy population, Dr. Farnsworth noted, citing a study in which the authors measured hs-cTnT and hs-cTnI in serum from 19,501 healthy individuals (Welsh P, et al. Clin Chem. 2018;64[11]:1607–1616). They found cTnT and cTnI concentrations to be weakly correlated and differentially associated with cardiovascular risk factors in a large general population cohort.
The patient in this case underwent cardiac catheterization and was found to have a 70 percent distal right coronary artery lesion for which she had a new stent placed. Her results were most consistent with macrotroponin I and acute myocardial infarction.
The takeaways: The two troponins don’t correlate well. MI equals the rise and fall in cTn with one value greater than 99th URL plus ischemia. Macrotroponin can be identified using PEG or protein A/G, and changing cTn is not expected with heterophile or macrotroponin. For future prevention, Dr. Farnsworth said, “We instructed the provider to order cardiac troponin T and not I. Very simple.”
Amy Carpenter is CAP TODAY senior editor.