
Amy Carpenter
November 2025—Puzzling out quandaries in the laboratory was at the heart of an ADLM session in July that took attendees through the speakers’ own experiences for the takeaways each offered.
Second of two parts.
Part one in the October issue.
Christopher Farnsworth, PhD, DABCC, associate professor of pathology and immunology at Washington University School of Medicine in St. Louis and medical director of clinical chemistry and point-of-care testing at Barnes-Jewish Hospital, shared a case that came to him of a 24-year-old female who presented as a study patient. Little information on the patient was available, so he looked at her chart, where he learned she had chronic nonimmune hemolytic anemia secondary to hereditary stomatocytosis and took light medications and a daily folic acid.
Her chemistry results revealed a critical potassium concentration (7.9 mmol/L). Anion gap (22 mmol/L), bilirubin (2.4 mg/dL), and ALT (92 U/L) were elevated. Creatinine was low (0.48 mg/dL). Glucose was 106 mg/dL. Other levels were normal.
On a second draw 90 minutes later, as part of the study, the patient’s potassium was 8.0 mmol/L.

Chemistry results from two months prior showed elevated bilirubin and ALT and low creatinine. Other results were normal. Her prior hematology tests revealed a normal WBC count (5.4 × 10⁹/L), slightly low RBC count (3.02 × 10¹²/L), and slightly elevated MCV (103.4 fL) and MCH (36.6 pg). No CBC was per-
formed.
What is the differential, he asked, and what should be the next steps?
In acidosis, he noted, potassium shifts out of cells and resolves upon correction of acidemia. With insulin deficiency, potassium shifts out of cells. In alkalosis, potassium shifts into cells and will resolve. Potassium shifts into cells also with insulin excess and glycolysis. No blood gas was performed. The patient’s glucose and CO2 results and relatively normal anion gap imply she is not acidotic or insulin deficient, Dr. Farnsworth said.
Potassium increases ~ 0.3 mmol/L for every 1 g/L increase in free hemoglobin, but hemolysis was ruled out in this case: The index was 7, which did not meet the hemolysis threshold for the laboratory’s Roche instrumentation.
EDTA contamination wasn’t thought to be a consideration because the patient’s calcium was in the normal range.
In general, Dr. Farnsworth noted, complete metabolic or basic panel samples should not be stored in cold temperatures because it stops glycolysis, and if glycolysis is inhibited, there is no early decrease in potassium. ATP will not be generated, so sodium and potassium ATPase stop working. Potassium increases ~1–2 mmol/L within four hours at 4°C, and it looks like hyperkalemia.
Dr. Farnsworth cited a 2003 study that found that exposure of samples to variations in ambient temperature during their transport to the laboratory profoundly affected measured serum potassium concentrations (Sinclair D, et al. J Clin Pathol. 2003;56[5]:385–388).
In this case, the laboratory team ruled out improper specimen storage in two ways: The second potassium sample result was also high, and the study team confirmed it had transported the first sample at room temperature.
In another study published years ago, fist-clenching during phlebotomy was found to cause increased potassium level concentrations (Don BR, et al. N Engl J Med. 1990;322[18]:1290–1292). “You’re going to see that potassium goes up as it comes out of the muscle as you clench,” Dr. Farnsworth said. “It goes up, and then as you stop clenching and take that tourniquet off, it returns back to baseline. This is not what happened in this case, but we’ve seen that before.”
Differences in potassium levels can be seen between plasma and serum based on the platelet count, he said. “If you have serum, as those platelets rupture,” potassium will rise, “kind of proportionally to the amount of platelets in those samples.” His laboratory used plasma.
The patient was sent to the emergency department, where her follow-up potassium result was 4.8 mmol/L. “Same exact laboratory, same exact analyzers, eight hours removed from each other,” Dr. Farnsworth said, noting her other laboratory values did not change significantly. A CBC was performed this time. RBC count was low (2.95 × 10¹²/L), MCHC was slightly elevated (35.8 g/dL), and ferritin was elevated (685 ng/mL). “She has a true hemolytic anemia that is pathologic,” he said. “However, in vivo that potassium is going to get gobbled up by muscles, and free hemoglobin by haptoglobin.”
In this case, once his laboratory received and processed the patient’s sample, it had an accurate potassium concentration. “When we let the sample sit for even a couple of hours—normally our stability is eight to 12 hours before processing—that patient continued to have the potassium leaking out due to a mutation” related to the hereditary stomatocytosis.
Laboratory staff learned she had a PIEZ01 mutation, “which physically causes potassium to potentially leak out of that channel and increase,” Dr. Farnsworth explained. Patients with this mutation are rarely clinically hyperkalemic (Andolfo I, et al. Am J Hematol. 2018;93[1]:107–121). The hematologist in the case was advised to have the patient’s samples processed immediately to avoid future problems.
The takeaways: “Many things can go wrong preanalytically with potassium,” Dr. Farnsworth said. Closely consider the clinical differential, “and process your sample as quickly as possible. Consider centrifuges in outpatient areas, and pay close attention to the clinical history.”
Joe M. El-Khoury, PhD, DABCC, professor of laboratory medicine at Yale School of Medicine and director of clinical chemistry at Yale-New Haven Health, reported on the investigation of a C-peptide proficiency testing failure.
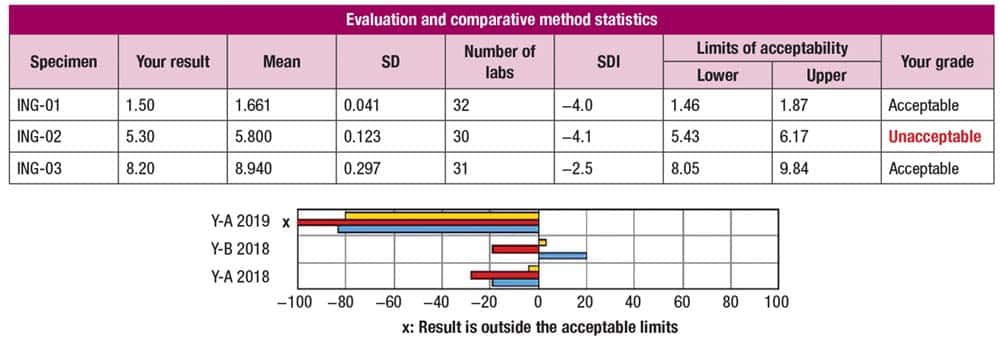
In Fig. 1 are the evaluation and comparative method statistics for an insulin Survey, and the standard deviation index results of −4.0, −4.1, and −2.5 indicate the laboratory’s results are outside those of 99 percent of participating laboratories for that test. The first and third sample results are within the lower and upper limits of acceptability; the second sample result is unacceptable. The laboratory’s performance on the last three Surveys (table at bottom) was acceptable.
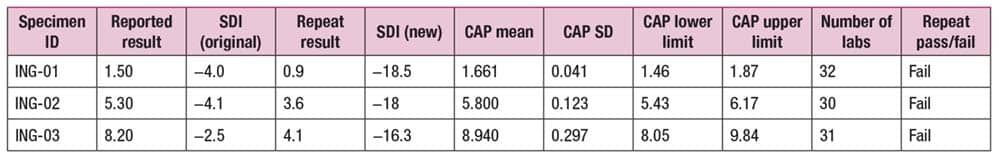
In Fig. 2 are the original and repeat results with new SDIs of −18, −18, and −16 for the three specimens. “So you’re now beyond the 0.0001 percent or 99.999 percent away from peers,” Dr. El-Khoury said, “and all of them fail.”
The Survey sample storage and stability instructions require that upon arrival, specimens are to be stored at 2° to 8°C until testing can be performed. One exception is C-peptide, which must be analyzed immediately after reconstitution. So, for such tests, the rerun results that are typically done weeks later as part of the investigation of a failure will not be useful. “This is a reminder that if you follow this process with some tests, it will fail,” he said. “It’s not because there is something wrong with your instrument.”
The laboratory’s quality control charts for C-peptide showed results were acceptable but trended low, “and then something happened that brought those results to the mean,” he said, and what caused it is the question. Was it a new lot of reagent? A new lot of QC? “Just because something has a QC in place does not mean it was OK.” With a QC range that is set too wide, significant bias will be missed, “and this is a problem I see when I inspect labs. People set their ranges too wide.”
The “stated” QC range is what the laboratory sets its limits at using a “stated” mean and a “stated” standard deviation; the “calculated” means and SDs are calculated based on all the data points within a certain time frame, which reflects how a method is running. In the case of this C-peptide Survey, “our stated QC is much wider than calculated,” Dr. El-Khoury said. “If I see two distributions on the graph, and the stated QC is wider,” it may have been “set to account for the wide variations, which is inappropriate.”
In his experience, it usually happens when a new test has been implemented and the manufacturer’s provided QC range is used. “Those [ranges] are usually meant for several labs and usually are too wide.”
This can also happen with a QC lot change if the values changed significantly and the laboratory did not adjust the standard deviations to match.
“A QC chart should look like an EKG,” Dr. El-Khoury said. “It should be going up and down the normal distribution. If you’re seeing a flat line on QC, just like a patient with a flat EKG, the quality in your lab is dead.”
The takeaways: “When faced with a PT failure, always ask why QC did not catch that and how can you stop it from happening again. And rerunning only works when the sample is stable,” Dr. El-Khoury said. In the case of this PT failure, his team tightened its QC ranges. “Anytime I look at a PT failure, I look at the QC and make sure they’re not too wide. I tighten them, and I never see this again,” he said.
In a case of discrepant hemoglobin results, Reid Rosehill, MS, MLS(ASCP), laboratory manager at the University of California San Francisco, presented 18 samples collected over two to three days.
For many of the collections there were discrepancies between the hemoglobin results from the laboratory’s analyzer and the whole blood hemoglobin results from blood gas analyzers, with the testing performed by a respiratory therapist. “There’s something going on,” Rosehill said, “and the QC is right where it needs to be.”
Both methodologies measure total hemoglobin (RBC Hb and plasma-free Hb). The patient samples had a turbidity flag when run on the hematology analyzer, so the laboratory performed a plasma blank and corrected the Hb value (corrected Hb = total Hb − plasma Hb).
“And this correction is what is causing the discrepancy between the result that is coming off of our blood gas analyzers from our therapy team and the result in our laboratory,” he said.
The takeaways: Include methodology notes in the electronic health record when possible. If feasible, consider adding brief interpretive comments to corrected results in the EHR to improve transparency and minimize confusion (for example: “Hemoglobin interference present. Result calculated using plasma blank procedure.”).
In addition, provider education may be needed when specialized corrections are used because some clinicians are not familiar with plasma blanking, Rosehill said. Thus, laboratories should be prepared to explain these corrections and their clinical implications.
In another case, this one from the coagulation bench, Rosehill recounted a situation in which both levels of quality control for prothrombin time were out more than two standard deviations at the start of a laboratory shift. All other tests using the same two vials of QC were acceptable. Partial thromboplastin time and fibrinogen were also run in this laboratory, and “those QCs look perfect,” Rosehill said, “right where you want them to be.”
During a QC review of the prothrombin time, laboratory staff discovered that a compromised reagent was loaded on the instrument before the first run. In investigating, a clinical laboratory scientist found there was no stir bar in the PT reagent. “If you don’t have that stir bar spinning around, keeping those phospholipids suspended in matrix, you’re basically running your test on buffer solution,” Rosehill said. “So your times are going to increase, your QC is going to slowly trend up. And that’s exactly what they found.”
A new vial of reagent was used; QC was run with the same vial and found to be acceptable. The logbook revealed that another clinical laboratory scientist had loaded the wrong reagent.
“So we found the issue, corrected the issue, put a new reagent on board, and the QC is great.”
Three patient result corrections were made because repeat testing met the laboratory’s threshold for correction. One result change was greater than 10 percent, another result moved from normal to abnormal, and a third result moved from abnormal to normal.
The corrective actions in this case included assigning the CLS to read and sign off again on the prothrombin time standard operating procedure, Rosehill said, and retraining on how to prepare and load prothrombin time reagent. To ensure the corrective actions were effective, the CLS was assigned to the coagulation bench at least one day per week for four weeks. The supervisor reviewed QC charts daily, and there were no reported problems with QC or reagent during those four weeks.
Recognizing the same trend in both QC levels for prothrombin time should have prompted an early investigation, Rosehill noted, and this highlights the importance of reviewing QC data at the start of each shift.
A deviation protocol can help to address problems caused by human error, and Rosehill recommends four parts:
- What is the issue? Include who is involved, what happened, where it happened, and when.
- Investigate to learn why, how, or both.
- Take corrective action.
- Evaluate the effectiveness of the corrective action.
Amy Carpenter is CAP TODAY senior editor.