November 2025—CAP Publications released recently its Color Atlas of Body Fluids: An Illustrated Field Guide Based on Proficiency Testing, second edition. In the atlas are more than 1,200 photographs, 70 photo galleries, 360 illustrations, 55 tables, and 15 videos featuring authors discussing their areas of expertise. Nearly 140 whole slide image links are found throughout. Eric F. Glassy, MD, senior editor of the atlas, created all cell drawings.
The new atlas completes the CAP’s Color Atlas series that includes the Color Atlas of Hematology, Color Atlas of Hemoglobin Disorders, and Color Atlas of Urinary Sediment (https://bit.ly/CAP_atlases). In the foreword to the newest atlas, Kyle Bradley, MD, hematopathologist at Emory University Hospital, writes, “[T]he Color Atlas series is as magical a resource as I have encountered, offering clarity and guidance not found elsewhere.”
Dr. Glassy answered CAP TODAY’s questions about the new body fluids atlas; his answers follow. (A sample chapter begins on page 27.) He is medical director at Affiliated Pathologists Medical Group, Rancho Dominguez, Calif. His associate editors on the body fluids atlas are Katherine A. Galagan, MD, formerly of Virginia Mason Medical Center in Seattle, and David Blomberg, MD, of Arrowhead Pathologists, PA, in Duluth, Minn.
In the atlas series and including in the newest book, the use of images from the CAP’s laboratory proficiency testing is part of what sets these atlases apart from others on the market. Can you expand on the value and importance of these images?

In a word: authenticity. PT images come from real specimens that thousands of labs have worked up, debated, and graded. They’re not idealized textbook shots—they capture the true variability you see at the bench, including the borderline and “is it or isn’t it?” cases that drive real diagnostic decisions.
Because these images originate in the CAP’s national proficiency testing programs, they’re already vetted in high-stakes settings. Participants reach consensus on what’s being shown, so each image doubles as a mini-standard: visually clear, clinically grounded, and selected for its teaching value, not just because it looks pretty.
That foundation turns the atlas from a static picture book into a working tool. Readers are training on the same kinds of materials used to assess laboratory performance, which tightens the link between education and quality assurance. Whether you’re prepping trainees, calibrating a team, or refreshing your own eye, you’re building competency with images that mirror daily practice and reinforce standardized interpretation.
There’s also a technology story here. PT imagery has evolved from 35-mm slides to static high-resolution digital files and now to whole slide imaging. The atlases mirror that trajectory, so readers get comfortable with modern formats as they study morphology. It’s practical for today and future-proof for where digital pathology is headed.
Bottom line is that using CAP PT images makes the Color Atlas series a curated collection of peer-reviewed, practice-informed diagnostic challenges. It keeps the content honest to real clinical variation, aligned with national QA processes, and delivered in the formats labs actually use. This enables readers to gain confidence that they can carry straight to the microscope or their digital viewer.
The first edition of the body fluids atlas was published in 2006. You write in the preface to the second edition that the new book is not just an update but a substantial evolution in scope and content. Can you explain?
The short answer: scale, depth, and interactivity. The new edition is more than 200 pages longer, with 1,200-plus photographs and 360 illustrations. It is a far broader visual library than the original. We’ve expanded beyond PT material to include images contributed by hematology experts, so readers see the full spectrum of real-world morphology.
We added 70 focused photo galleries—for example, cell death, stain precipitate, neoplastic morphology—that show variation within categories. These side-by-side sets train pattern recognition—what you need at the microscope when cases don’t look like “perfect” textbook examples.
In 2006, digital microscopy wasn’t in reach. Now, embedded DigitalScope links let readers explore specimens at multiple magnifications. This turns static pages into a virtual slide session that mirrors daily practice.
This second edition provides stronger foundations for the understanding of body fluid analysis. The introductory sections for each fluid type are substantially expanded, and a new multidisciplinary approach to body fluids brings in current testing technologies and how they integrate across lab disciplines.
We have added multimedia teaching. We continued the CAPsules video vignettes concept, which we introduced in the Color Atlas of Hematology, second edition. QR codes connect readers to concise teaching videos from 15 distinguished authors, delivering practical tips and expert judgment you can’t glean from images alone.
In the end, this edition isn’t a cosmetic refresh. It’s a larger, richer, and more hands-on atlas that blends peer-reviewed images, expert perspective, and virtual microscopy—so users can learn the way they actually work.
Nearly 40 discussions titled “A Closer Look At . . .” appear throughout the book, on such topics as eosinophilic synovitis; monocytes, macrophages, and mesothelial cells; ciliocytophthoria; and choroid plexus papilloma. What is the purpose of these closer looks and what should readers expect to find in them?
The closer looks are deep dives. They are built to go beyond what a standard PT identification can cover. The idea came about during the creation of the first Color Atlas of Hematology. I noticed that some topics needed much more detailed coverage than what the traditional proficiency testing identification format could offer. Certain topics are too complex for a quick single-cell write-up. The closer look sections fill that void. They maintain the PT-based, image-focused style but provide the space to explore morphology, differentials, pitfalls, and interpretive subtleties at an expert level.
These sections also offer clear frameworks for recognition and differential diagnosis, including what mimics what and why. In many cases, we’ve added photo galleries that show variation, not just archetypes, to help pattern recognition stick better. They provide practical pearls, common traps, and interpretive checkpoints that you can use the next time a tricky cell population appears.
Two examples are those written by Maria (Ria) Vergara-Lluri, MD, one of which is a closer look at malignant cells in body fluids. The main atlas provides core features and 19 PT cases. This closer look expands that into a 45-page, image-rich guide with 195 additional photomicrographs. Side-by-side panels compare benign and malignant cells, highlighting nuclear shape, chromatin texture, cytoplasm, vacuoles, mitoses, size, and pleomorphism, among other features. It helps readers move from “looks suspicious” to “here’s why.”
The other is on the evolution and visual hallmarks of cell death. This is a thorough overview of degenerative changes, helping you distinguish between artifacts and stain precipitate, from genuine cell death and apoptosis.
The closer look features are where the atlas slows down and teaches the hard stuff, like the subtleties of morphology, its complex differentials, and real-world interpretation. This complements the practical, PT-identification-driven feel that underpins the atlas. They’re designed to build fluency, not just familiarity.
All of this and more explains why you describe this atlas in the preface as “not just a reference tool but an immersive educational experience.”
Two big shifts turn it into a hands-on learning environment.
First, virtual microscopy is built in. Traditional atlases freeze a few “perfect” images in print. Real life isn’t like that—there are edge cases, artifacts, and fields where the truth is in the context. With embedded DigitalScope whole slide links, readers can pan the entire cytospin smear, zoom through fields, and perform virtual differentials the way they do at the bench and in the office. This builds judgment, not just memory.
The virtual body-fluid smear PT program was launched in 2012, extending the CAP’s quality mission into interactive training. This atlas contains more than 75 whole slide image links available through 2025, each reachable by QR code on a phone or workstation. As I’ve said, users see cells in situ. They see the true morphology, distribution, and context, replicating clinical workflow rather than a curated snapshot.
Second, the atlas provides expert instruction on demand in the form of the 15 short video vignettes. They’re concise, targeted briefings on topics like Pneumocystis, Ehrlichia, gout, leukemia in CSF, and lymphomas. The videos layer practical pearls and what-to-watch-for cues on top of the images, so readers get both the visual and the expert’s reasoning in one place.
The atlas now teaches the way laboratories actually work, with full-slide exploration, real-world variation, and guided expert commentary. Readers don’t just see morphology; they practice it.
What should readers know about the many contributors to the book?
The creation of this atlas has been a testament to collaborative excellence. The contributions of the Blomberg and Galagan team have been invaluable, with Katherine Galagan serving as the linchpin of our efforts. We are particularly fortunate to have assembled an outstanding group of authors who bring a unique and invaluable perspective to this work.
Every contributing author is a current or past member of the CAP Hematology/Clinical Microscopy Committee, bringing with them an intimate understanding of proficiency testing that extends far beyond theoretical knowledge. This collective expertise in proficiency testing development, review, and analysis provides readers with insights that can only come from those who have been deeply involved in creating and evaluating the very specimens that challenge laboratory professionals worldwide.
These authors don’t merely present textbook knowledge—they offer the practical wisdom gained from years of hands-on experience in body fluid analysis. Their contributions reflect real-world understanding of the challenges, pitfalls, and nuances that practicing laboratory professionals encounter daily. Having worked extensively with proficiency testing materials, they understand which morphological features are most diagnostically significant, which differential diagnoses are most commonly confused, and which practical approaches yield the most reliable results.
This unique authorship brings an authenticity and practical relevance to every chapter that distinguishes our atlas from other publications in the field. Readers benefit not only from the authors’ individual expertise but also from their collective understanding of how body fluid analysis is practiced in laboratories across diverse clinical settings.
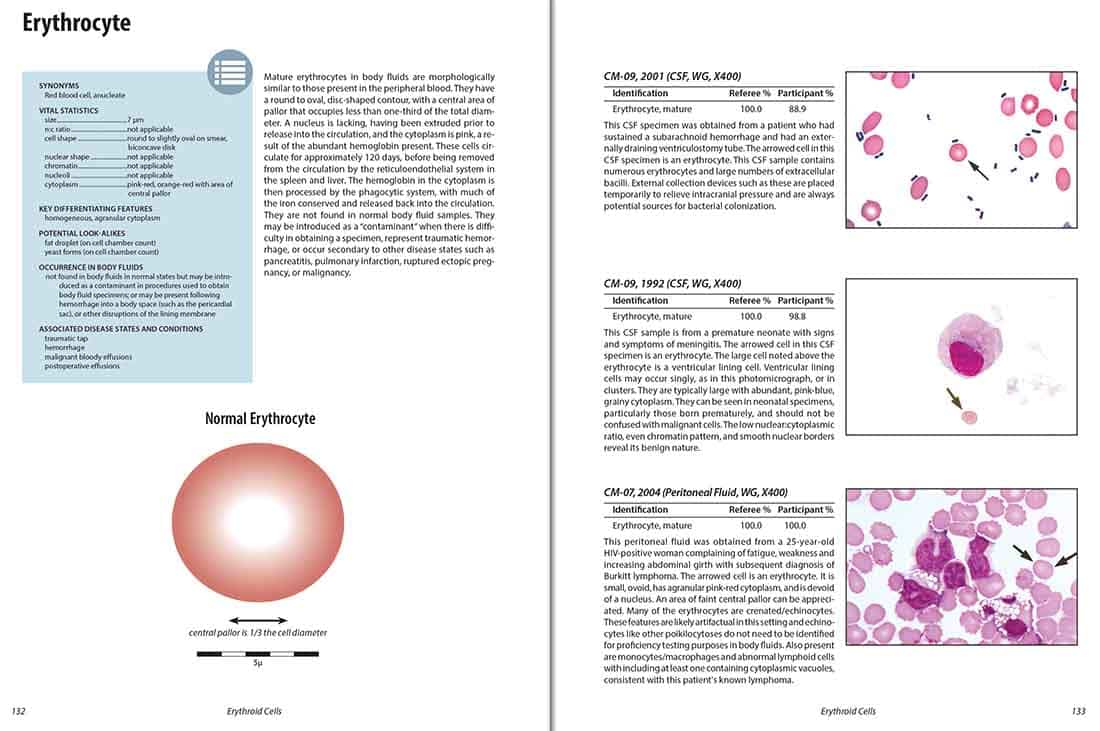
 Below is the chapter on erythrocytes by Natasha M. Savage, MD, professor of pathology and medical director of hematology and hematopathology, Medical College of Georgia at Augusta University. To order the book (PUB235), go to https://bit.ly/CAP_atlases.
Erythrocytes
Erythrocytes are a functional component of blood and responsible for the transportation of oxygen throughout the body. The red blood cell’s shape is critical to its function allowing it to easily move through vasculature, even tiny capillaries, due to its flexibility and innate ability to deform. Moreover, its high surface area to volume is ideal for efficient diffusion of critical gases. Amazingly, human red blood cells take on average 60 seconds to complete one cycle of circulation. An adult has on average 20-30 trillion red blood cells, making the erythrocyte the most frequent cell in the human body. On average, women have about 4–5 million red blood cells per microliter (cubic millimeter) of blood and men about 5–6 million, but this varies based on many factors such as living in high altitudes. Given the erythrocyte’s life span of approximately 120 days, the body makes about 2 million red blood cells per second. Erythrocytes are a common finding in body fluids and are typically easy to identify due to their unique appearance and frequency. Along with total nucleated cell count, the red blood cell count is a standard component of the body fluid cell count and differential. If the sample is cellular, the red blood cell count may be determined by an automated instrument, as they are with a complete blood count, or may be determined via microscopy using a hemocytometer for low cellularity samples.