Anne Paxton
September 2021—The pandemic has pelted hospitals and laboratories with wild cards and sometimes thrown wrenches into the works. But the jolts it has delivered to normal institutional operations, forcing new solutions to business and clinical care dilemmas, have also positioned laboratories to help produce stunning new capabilities.
The clinical analytics program at NorthShore University HealthSystem in suburban Chicago provides a model for how laboratory data can help institutions redeploy clinical care resources, adeptly adjust staffing and supplies, preempt negative impacts on patient care, and recover operational capacity and financial stability during a crisis.
Though NorthShore is a large integrated system consisting of six hospitals, its methods to develop its own analytic solutions can be used by community care and academic health care providers to create their own in-house or vendor-based solutions, says Chad Konchak, MBA, assistant vice president of clinical analytics. He wants to help other institutions and laboratories discover for themselves something he asserts with confidence: “There’s incredible untapped value in your data.”

Konchak
NorthShore clinical analytics, which began 11 years ago as a two-person unit, has grown to a staff of 25 and was not caught flat-footed when the pandemic hit. As in any crisis, there was a deluge of requests and requirements, Konchak says. But his unit launched its Data CART (Coronavirus Analytics Research Team) governance group around the same week in March 2020 that NorthShore admitted its first COVID-19 patient and shut down elective surgeries.
The Data CART would track and manage activities across NorthShore that were affected by SARS-CoV-2. “With analytics, the technology is the easiest part. It’s the soft-governance stuff that can be complicated, especially in a pandemic when all the timelines accelerated. It usually takes months just to define things.”
The NorthShore clinical analytics program, however, was exceptionally well prepared. NorthShore is one of only six health care organizations worldwide at the highest level of digital transformation maturity, as evaluated by the Healthcare Information and Management Systems Society, based on electronic medical record adoption, outpatient EMR adoption, and data analytics.
Before the pandemic, NorthShore had used its clinical modeling capability for disease surveillance, cardiovascular risk assessment, and diabetes care. So NorthShore was well positioned to develop comprehensive COVID-19 tracking, data visualization, and analytical dashboards to support clinicians. The analytics program’s performance during the past 18 months continued to bear out the known concept, Konchak says, that “business intelligence maturity enables hospital agility.”
NorthShore developed its own SARS-CoV-2 PCR test early on. That gave NorthShore “a relatively straightforward understanding of who’s positive, who’s negative, and who’s putative,” he says, “whereas other organizations had to draw a lot of inferences from symptoms.”

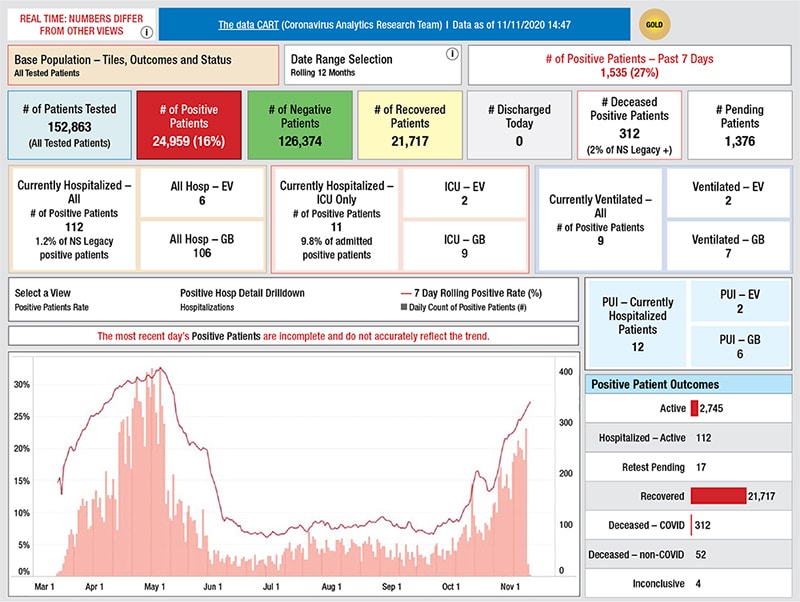
Data CART dashboard landing page. Numbers updated in real time (hourly refresh). The overall testing metrics on the first row are uploaded to a corporatewide employee website, increasing transparency of information. Hospitalization, intensive care unit, and ventilation censuses allow operations to understand available capacity in real time. Trending data at the bottom are aggregated over rolling seven-day periods to account for weekday/weekend variation. Data were collected from the internal Epic electronic health record system and visualized in Tableau 2019.2.
Konchak CW, Krive J, Au L, et al. From Testing to Decision-Making: A Data-Driven Analytics COVID-19 Response. Academic Pathology. January 2021. doi:10.1177/23742895211010257. Reused under license CC BY-NC-ND 4.0
Data like these became key indicators in the Data CART dashboard. “Our system needed to understand so many different things like our volumes on our different units and historical data,” Konchak says, in order to maintain care of the stroke and heart attack patients whom NorthShore would continue to admit as well as the COVID patients. Paired with predictive analytics on the spread of the disease, the indicators allowed the system to plan critical care nurse and physician staffing and detect areas in the community where jumps in disease spread were occurring or inequities in testing were developing.
The dashboards blend real-time reporting, updated hourly, and analytical and predictive capabilities in a single format that can be accessed on demand. Originating in SoftLab, the laboratory data flows into the Epic EHR and to a COVID data mart in the enterprise data warehouse, which feeds the primary analytics tools. The process employs the statistical programming language “R” to provide advanced analytics while data manipulation for the dashboard is carried out by the visualization software Tableau, which “is what’s making the magic happen,” Konchak says.
As the pandemic continued, the data and analytics helped keep tabs on multiple parameters of the disease and the hospitals’ operations while also supporting NorthShore’s return to normal, because restoring elective surgery volumes was one of the most important goals not only for patient care but also for NorthShore’s financial stability. “The data actually predicted the pandemic waves and breaks,” Konchak says, “so we were able to hit the ground running and start to turn things back on.” With the dashboard updated hourly, “we were able to monitor the data in close to real time, which allowed us to make close to real-time adjustments.”
 CAP TODAY Pathology/Laboratory Medicine/Laboratory Management
