
Q. One of our providers noticed that two laboratories—one in New York and one in Florida—reported very different thyroid-stimulating hormone values for a patient and called our laboratory to determine which was correct. How should we handle such situations?
A. Differences among laboratories in reported thyroid-stimulating hormone (TSH) values and testing methods used on the same patient or even the same sample are not surprising. The most important factors that cause these differences are standardization and calibration bias, differences in specificity among methods, and differences in reference populations.
Standardization and calibration bias. In a CAP study, published in 2005, that used fresh frozen human serum, 17 TSH methods had mean differences of up to 0.48 mU/L at an average TSH level of 1.46 mU/L, or a difference as high as 39 percent when comparing the method with the highest values to that with the lowest values.1 A 2010 report from the IFCC Working Group for Standardization of Thyroid Function Tests similarly showed a broad range of differences among 16 immunoassays for TSH, using a panel of 40 human samples.2 In the IFCC study, the most discrepant TSH testing methods differed by an average of 39 percent, similar to the findings reported by the CAP in 2005.1 The IFCC Working Group noted that in view of these findings, harmonization of TSH testing methods may be beneficial, particularly in light of contemporary clinical practice guidelines proposing to lower the TSH clinical decision limit.3
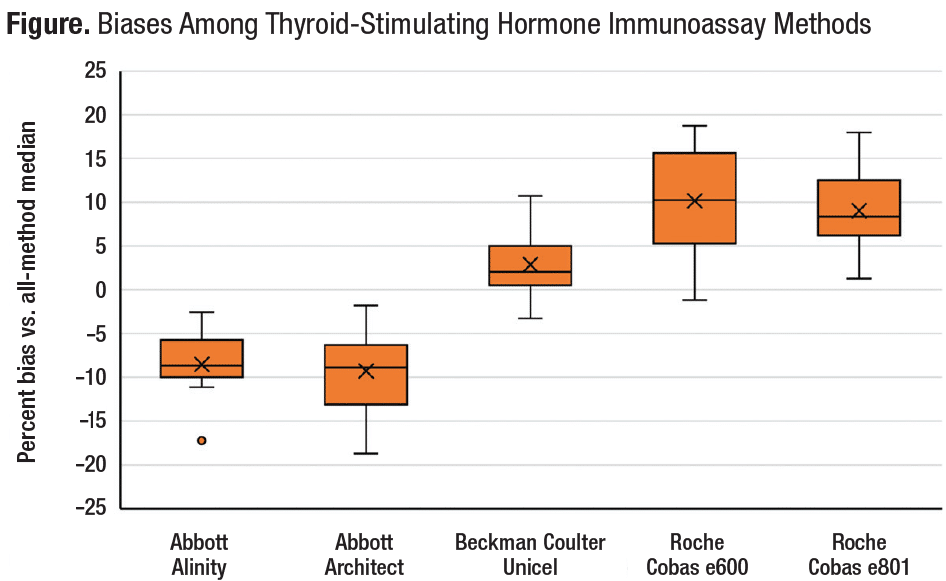
Despite ongoing standardization efforts, recent data from the CAP Accuracy-Based Programs (figure) demonstrate that when using pooled human serum specimens to compare testing methods, differences in standardization have been consistent and persistent.
Differences in specificity among methods. A 2013 article by Faix and Thienpont described the current state of the art and challenges in measuring TSH.4 In particular, the authors highlighted the role of molecular heterogeneity in TSH measurement. They reported that the pituitary gland releases a heterogeneous mixture of TSH glycoforms, an array of unique molecules with various carbohydrate side chains. This high degree of molecular heterogeneity, especially with respect to glycosylation, contributes to a broad range of measurable epitopes. Since immunoassays employ a variety of monoclonal antibodies, each type varying in its ability to detect TSH epitopes, the amount of TSH measured in a clinical sample by a given testing method depends not only on the testing method’s standardization but also on the selection of monoclonal antibodies in the manufacturer’s reagent kit. This variability can potentially lead to different TSH results across methods used on the same samples, even with well-standardized TSH testing methods. In addition to variability in specificity due to differences in selectivity for TSH epitopes, discrepant TSH values may be attributable to interference from autoantibodies or macro-TSH.5
Differences in reference populations. TSH reference intervals also vary among testing methods.6 The TSH reference interval defined by each manufacturer is sensitive to the manufacturer’s selection of individuals included in the reference population. Including certain subgroups may skew the high end of the distribution, making it non-Gaussian. Including older adults, in whom higher TSH levels are often observed, is one example. People with obesity compose another subgroup that typically has higher TSH values, unrelated to thyroid function.
Until TSH test methods are harmonized, laboratories should exercise caution when comparing results from different TSH testing methods. And when practicable, the same testing method should be used each time when monitoring a patient known to have thyroid disease.
- Steele BW, Wang E, Klee GG, et al. Analytic bias of thyroid function tests: analysis of a College of American Pathologists fresh frozen serum pool by 3900 clinical laboratories. Arch Pathol Lab Med. 2005;129(3):310–317.
- Thienpont LM, Van Uytfanghe K, Beastall G, et al. Report of the IFCC Working Group for Standardization of Thyroid Function Tests; part 1: thyroid-stimulating hormone. Clin Chem. 2010;56(6):902–911.
- Demers LM, Spencer CA, eds. Laboratory Medicine Practice Guidelines: Laboratory Support for the Diagnosis and Monitoring of Thyroid Disease. National Academy of Clinical Biochemistry; 2002.
- Faix JD, Thienpont LM. Thyroid-stimulating hormone: why efforts to harmonize testing are critical to patient care. Clinical Laboratory News. May 1, 2013. https://www.aacc.org/cln/articles/2013/may/tsh-harmonization
- Hattori N, Ishihara T, Shimatsu A. Variability in the detection of macro TSH in different immunoassay systems. Eur J Endocrinol. 2016;174(1): 9–15.
- Barth JH, Luvai A, Jassam N, et al. Comparison of method-related reference intervals for thyroid hormones: studies from a prospective reference population and a literature review. Ann Clin Biochem. 2018;55(1):107–112.
Neil Greenberg, PhD, DABCC
Principal Consultant
Neil Greenberg Consulting Services LLC
Rochester, NY
Member, IFCC Working Group on Commutability in Metrological Traceability
Member, CAP Accuracy-Based Programs Committee